
Bar Graph Worksheets: 10 Free Printables with Answers
Preview every worksheet, choose colour or black and white and your paper size, then download your bar graph worksheets in one small ZIP file.
A4 and US Letter10 worksheetsFree

Can’t find the template you need? Request a template and I’ll make it in Word, free.
Get new free printables first: follow Word Made Easy on Pinterest
These free bar graph worksheets take children from their first block graph to reading scales. Each category has its own column of squares, so a child can colour one square for every pig or kite they count, then compare the bars to find the most, the fewest and the difference. Later sheets give the numbers in a table and leave the bars blank, count in 2s and 5s, turn the graph on its side, and ask children to write the title and labels themselves. The themes run all year: farm animals, toys, pets, sea creatures, a class party, eggs, the weather, sports day, favourite colours and lost property. Every bar, count and answer has been checked against the same data, so each graph has one right answer.
Below you’ll find what each part of a bar graph is for, which sheet to give first, and how to help a child who misreads a scale.
What’s in the Bar Graph Worksheets Pack
| Worksheet | What is on it |
|---|---|
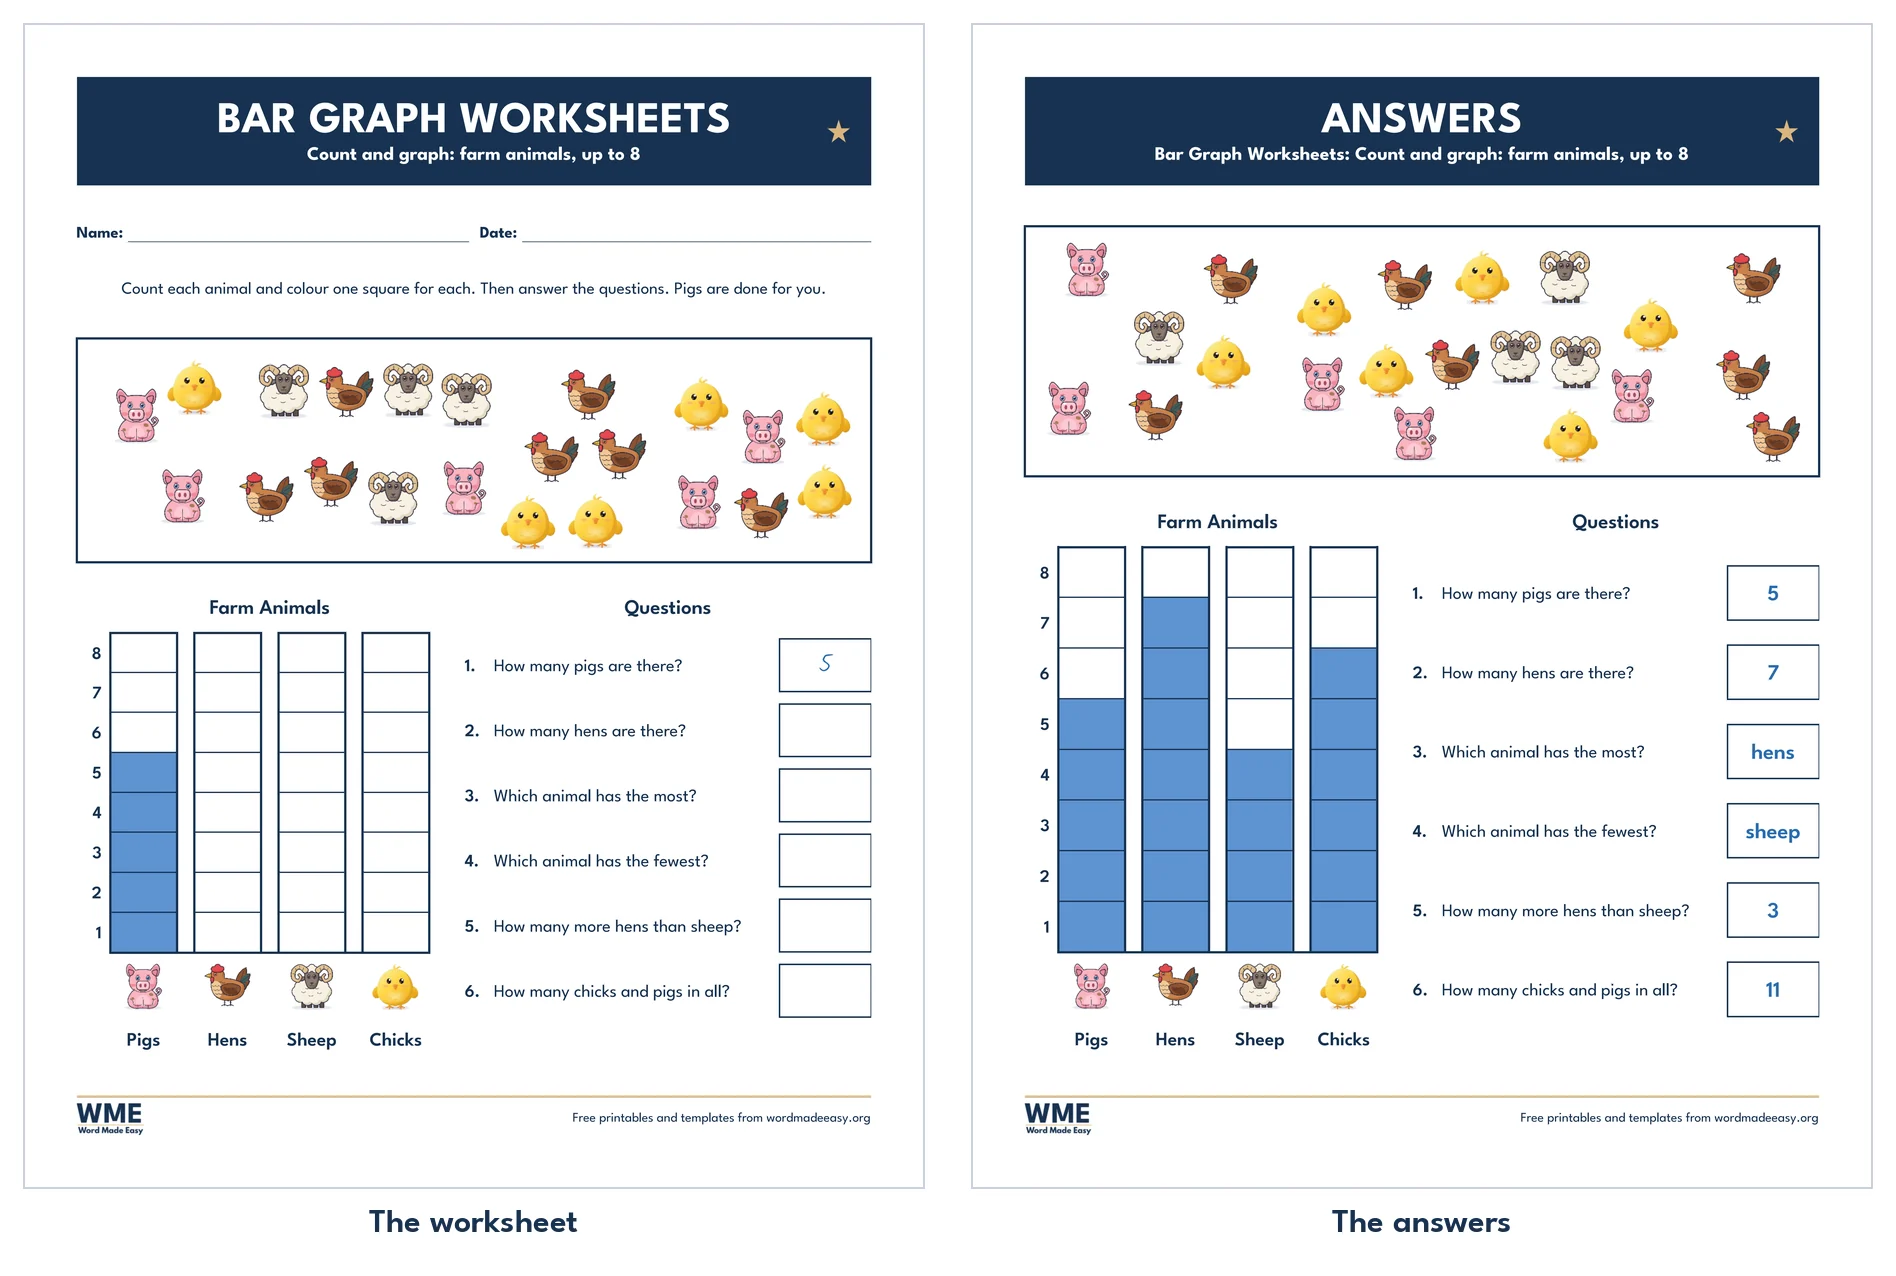
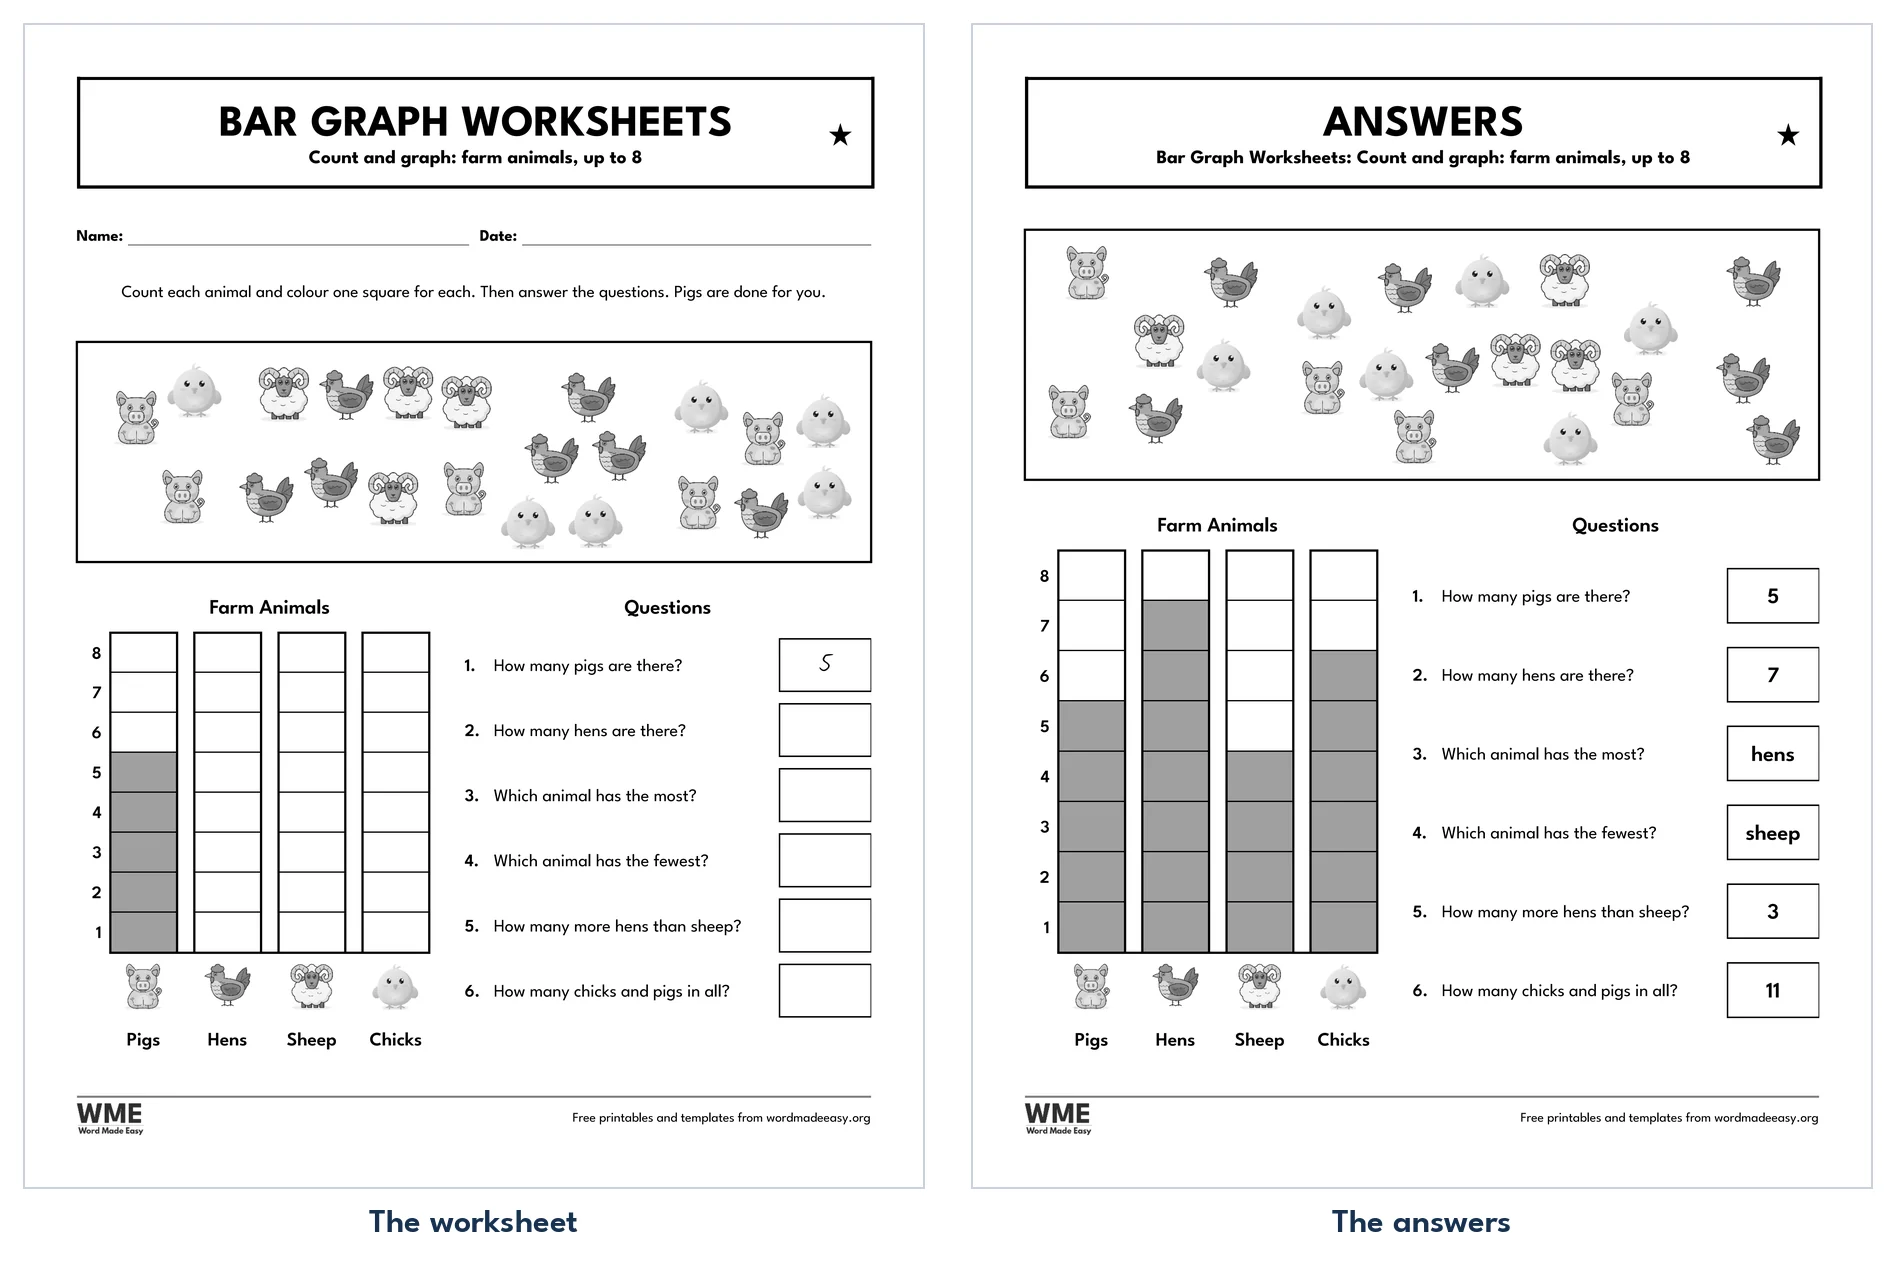
| Count and Graph 1 | 1 star: Count the farm animals and colour the bar graph, 6 questions, with answers |
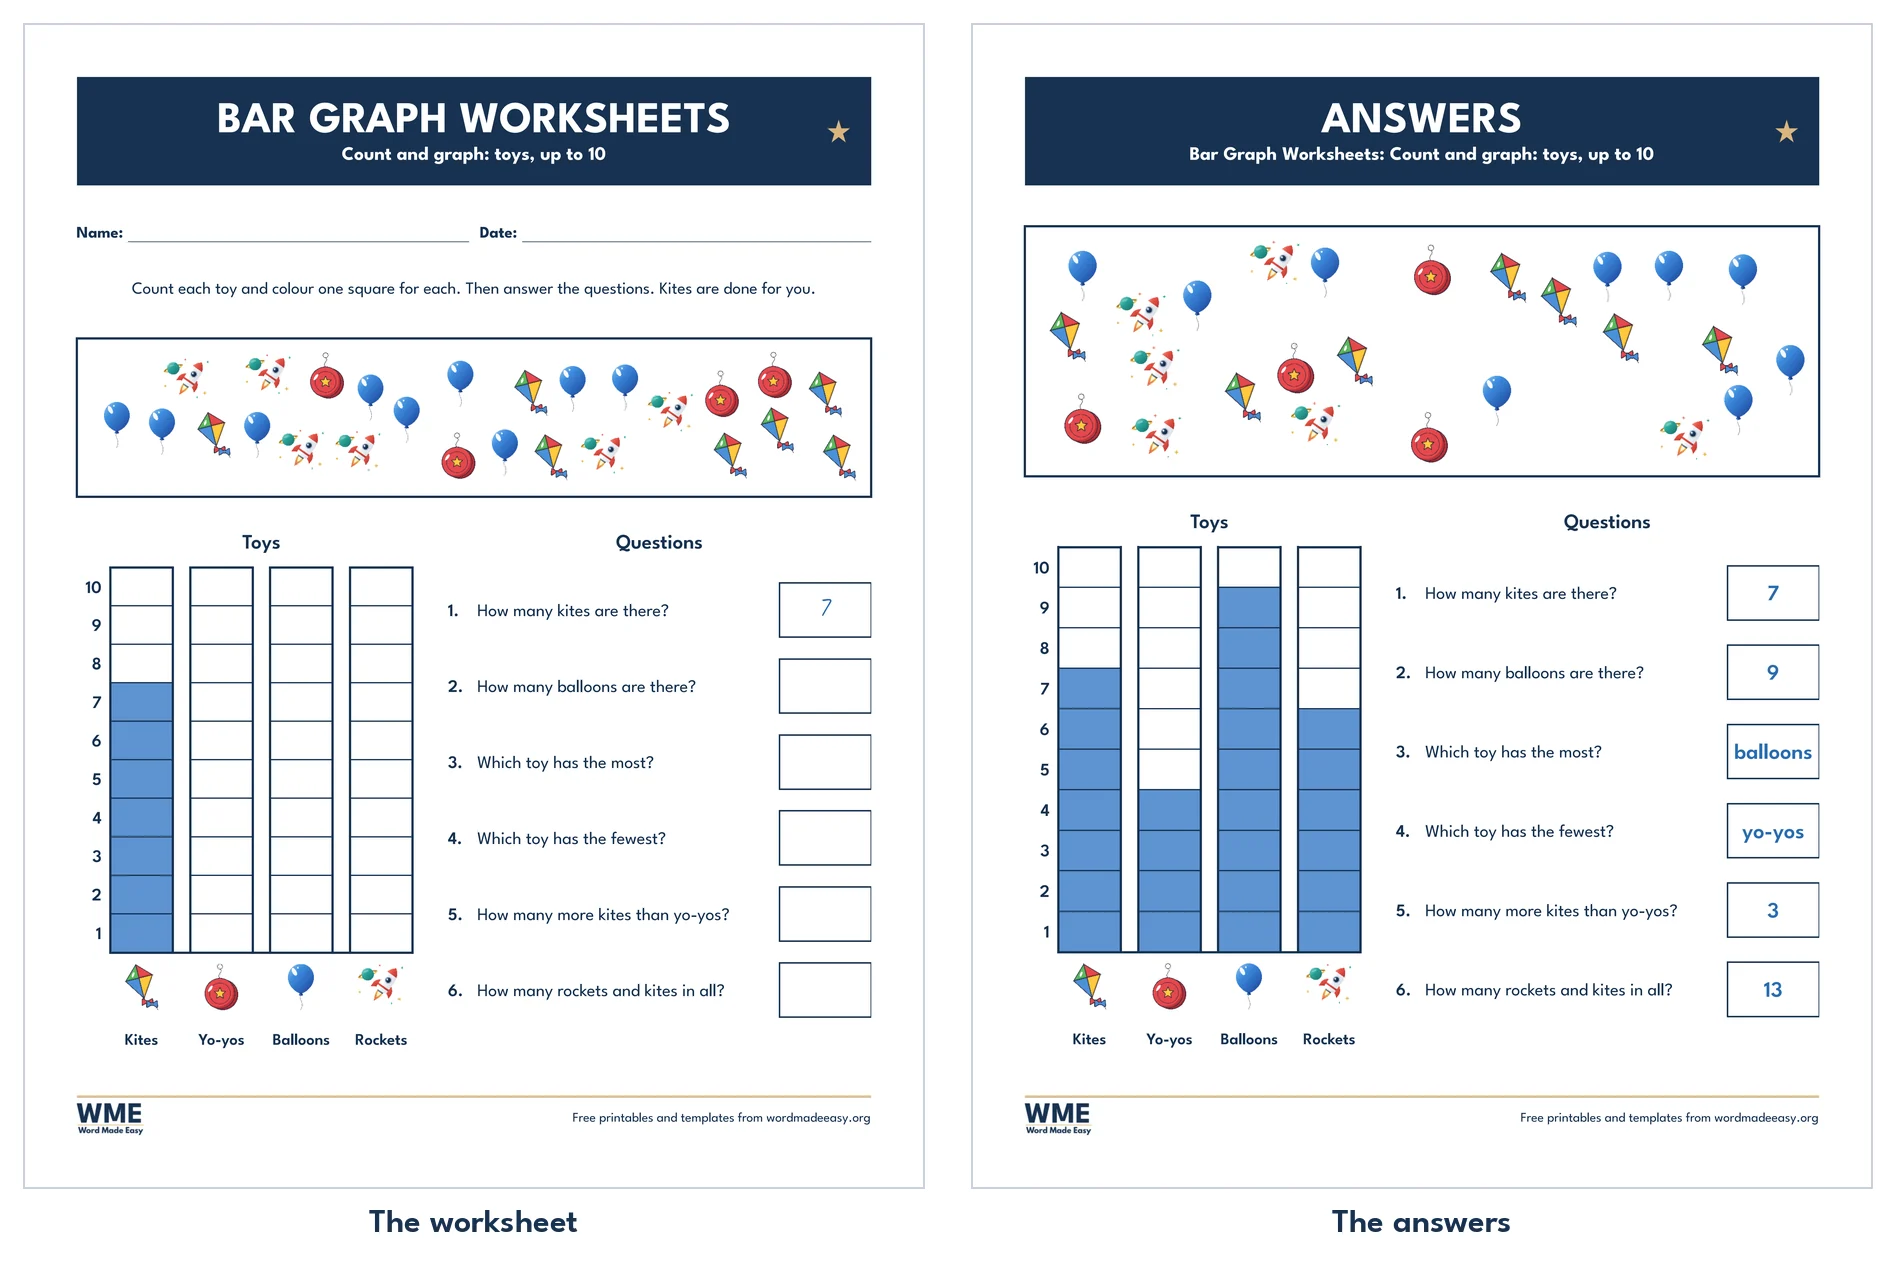
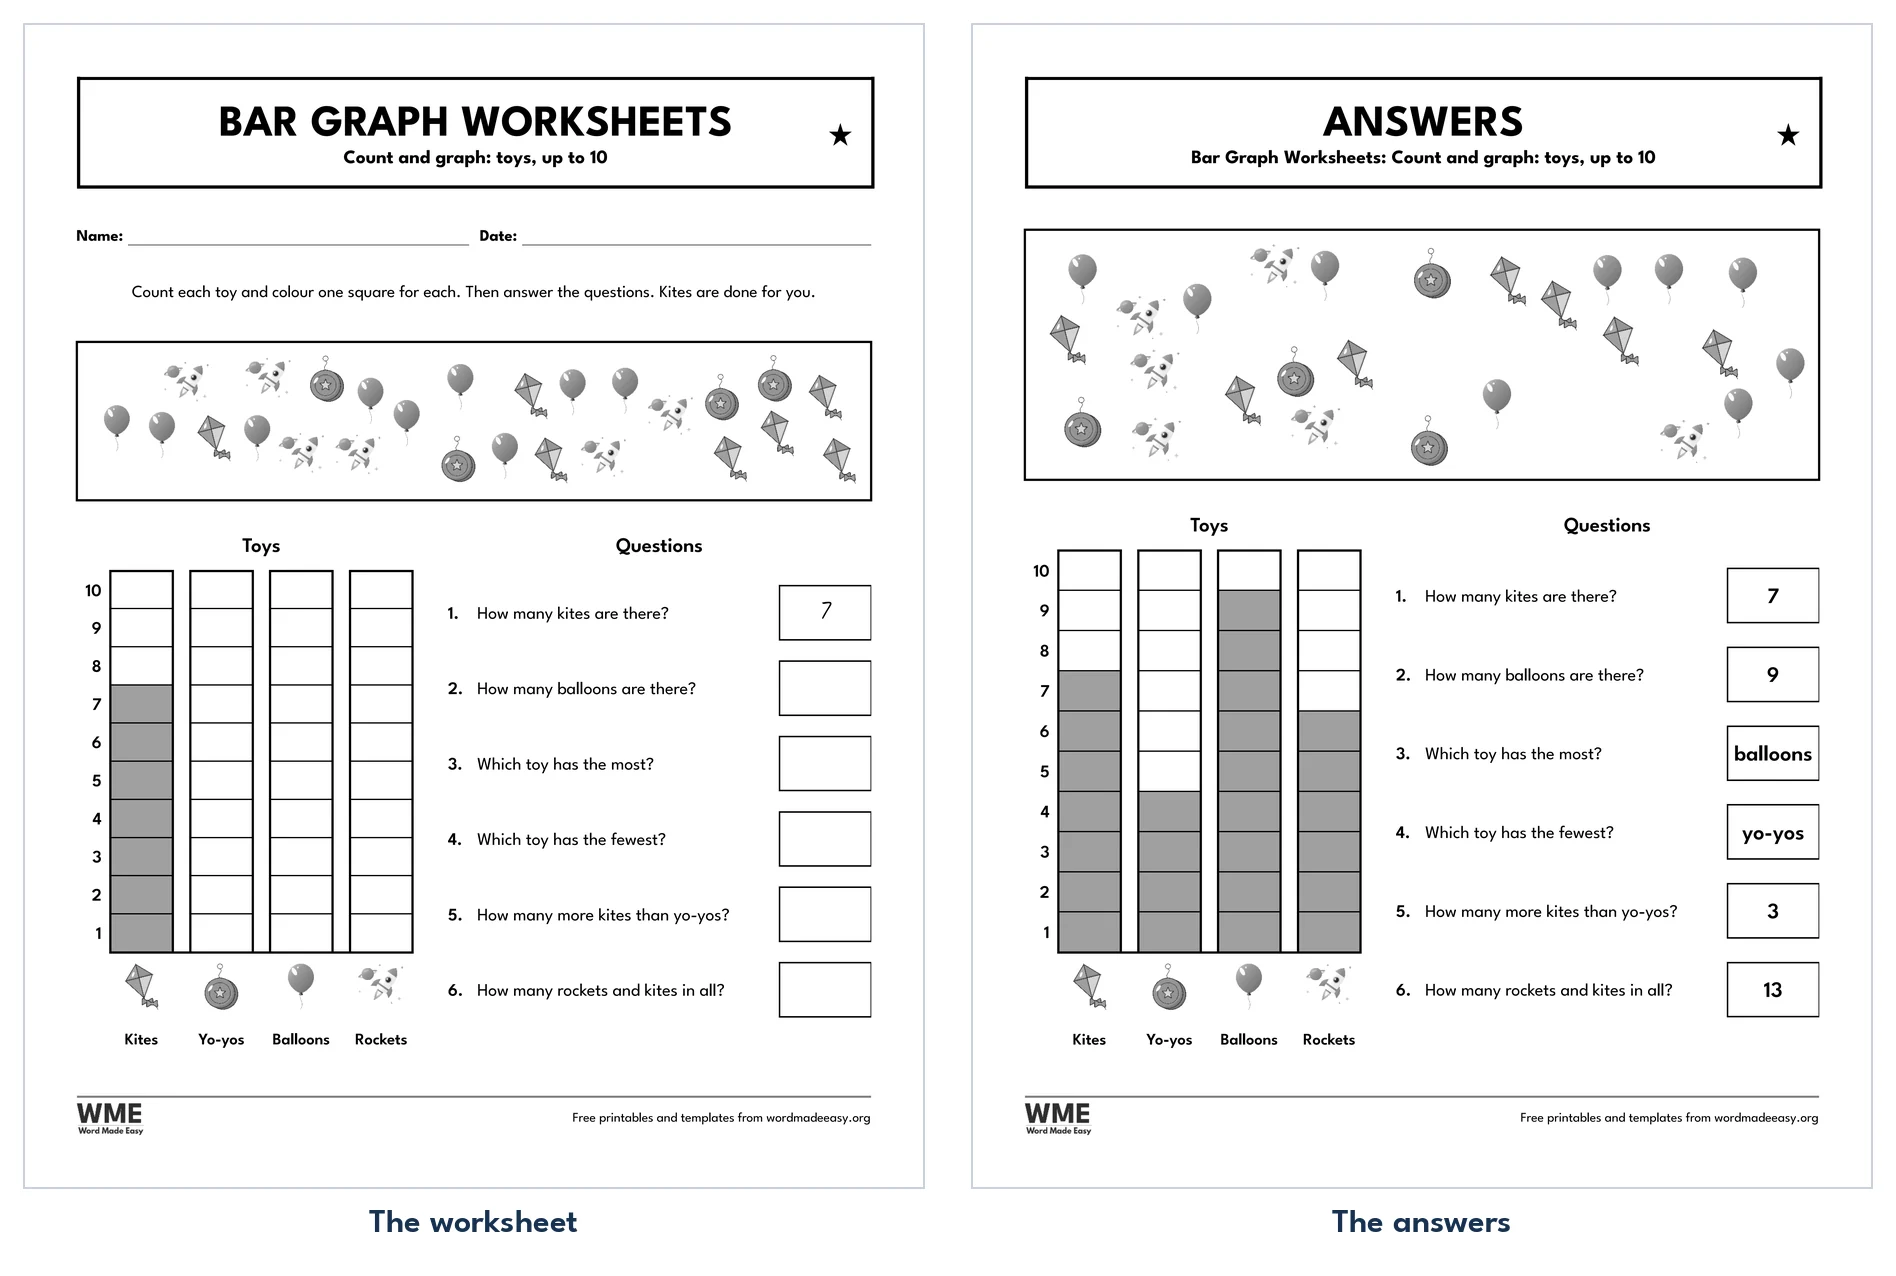
| Count and Graph 2 | 1 star: Count the toys and colour the bar graph, 6 questions, with answers |
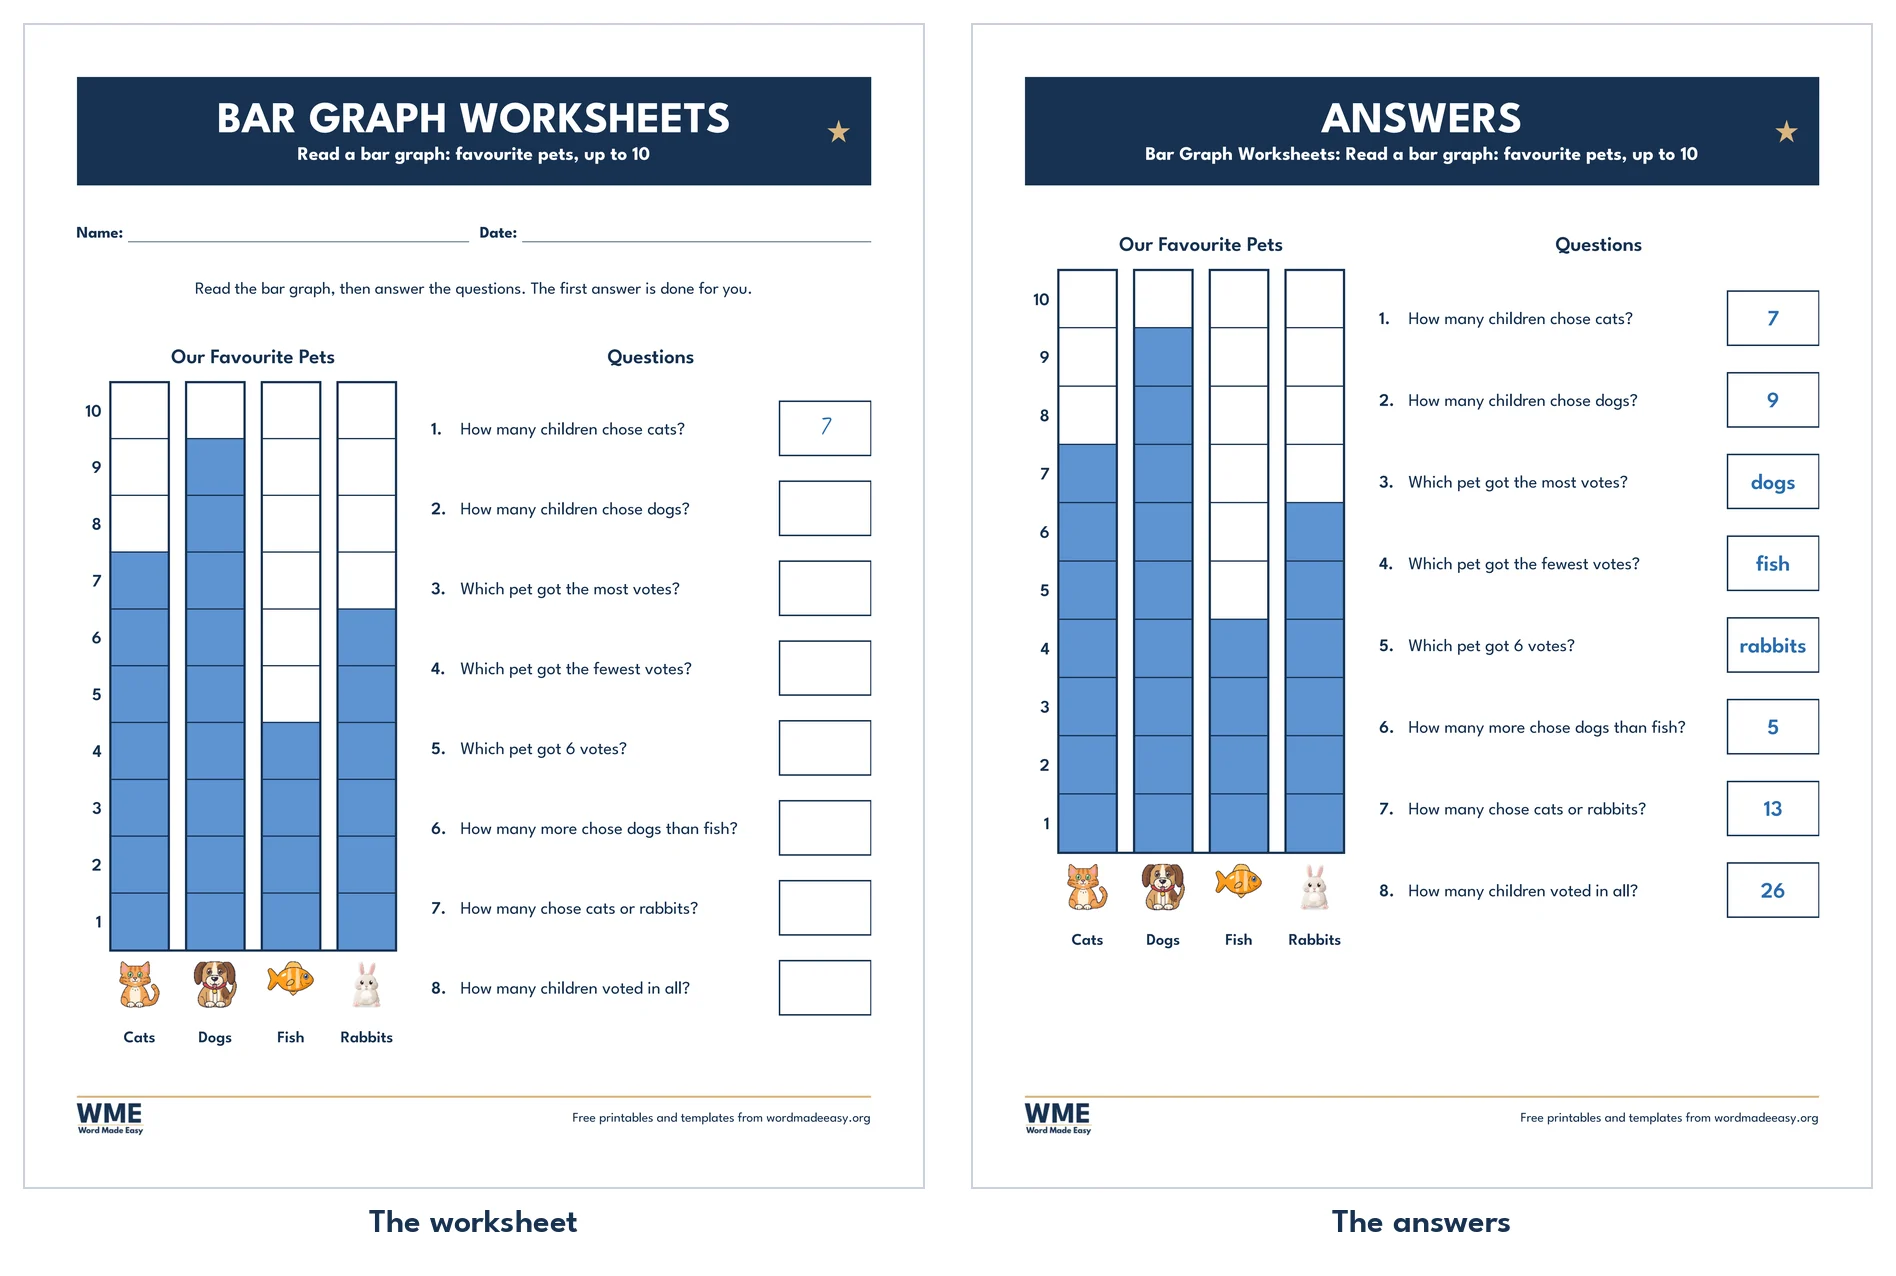
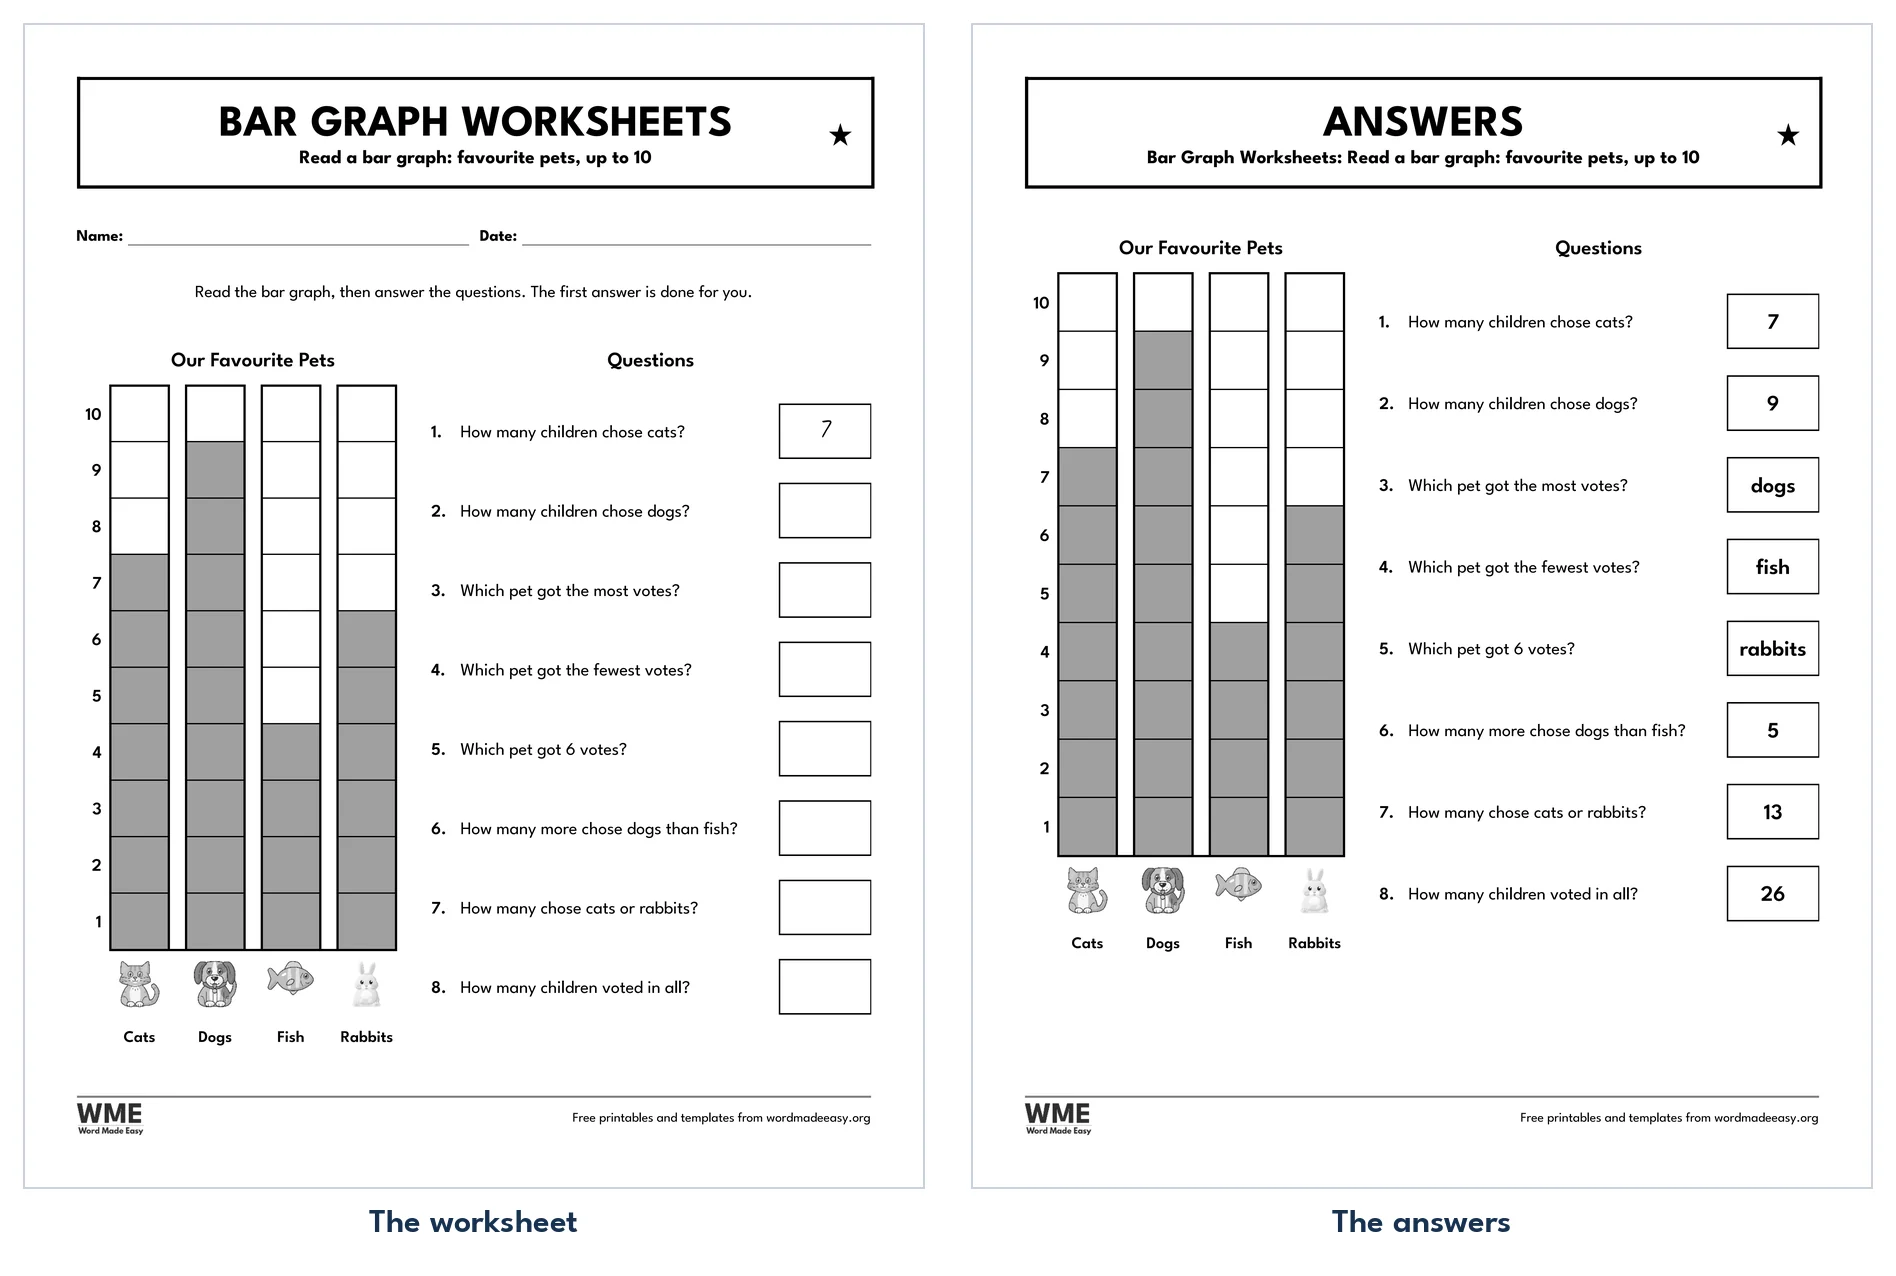
| Read the Bar Graph 3 | 1 star: Read a finished bar graph of favourite pets, 8 questions, with answers |
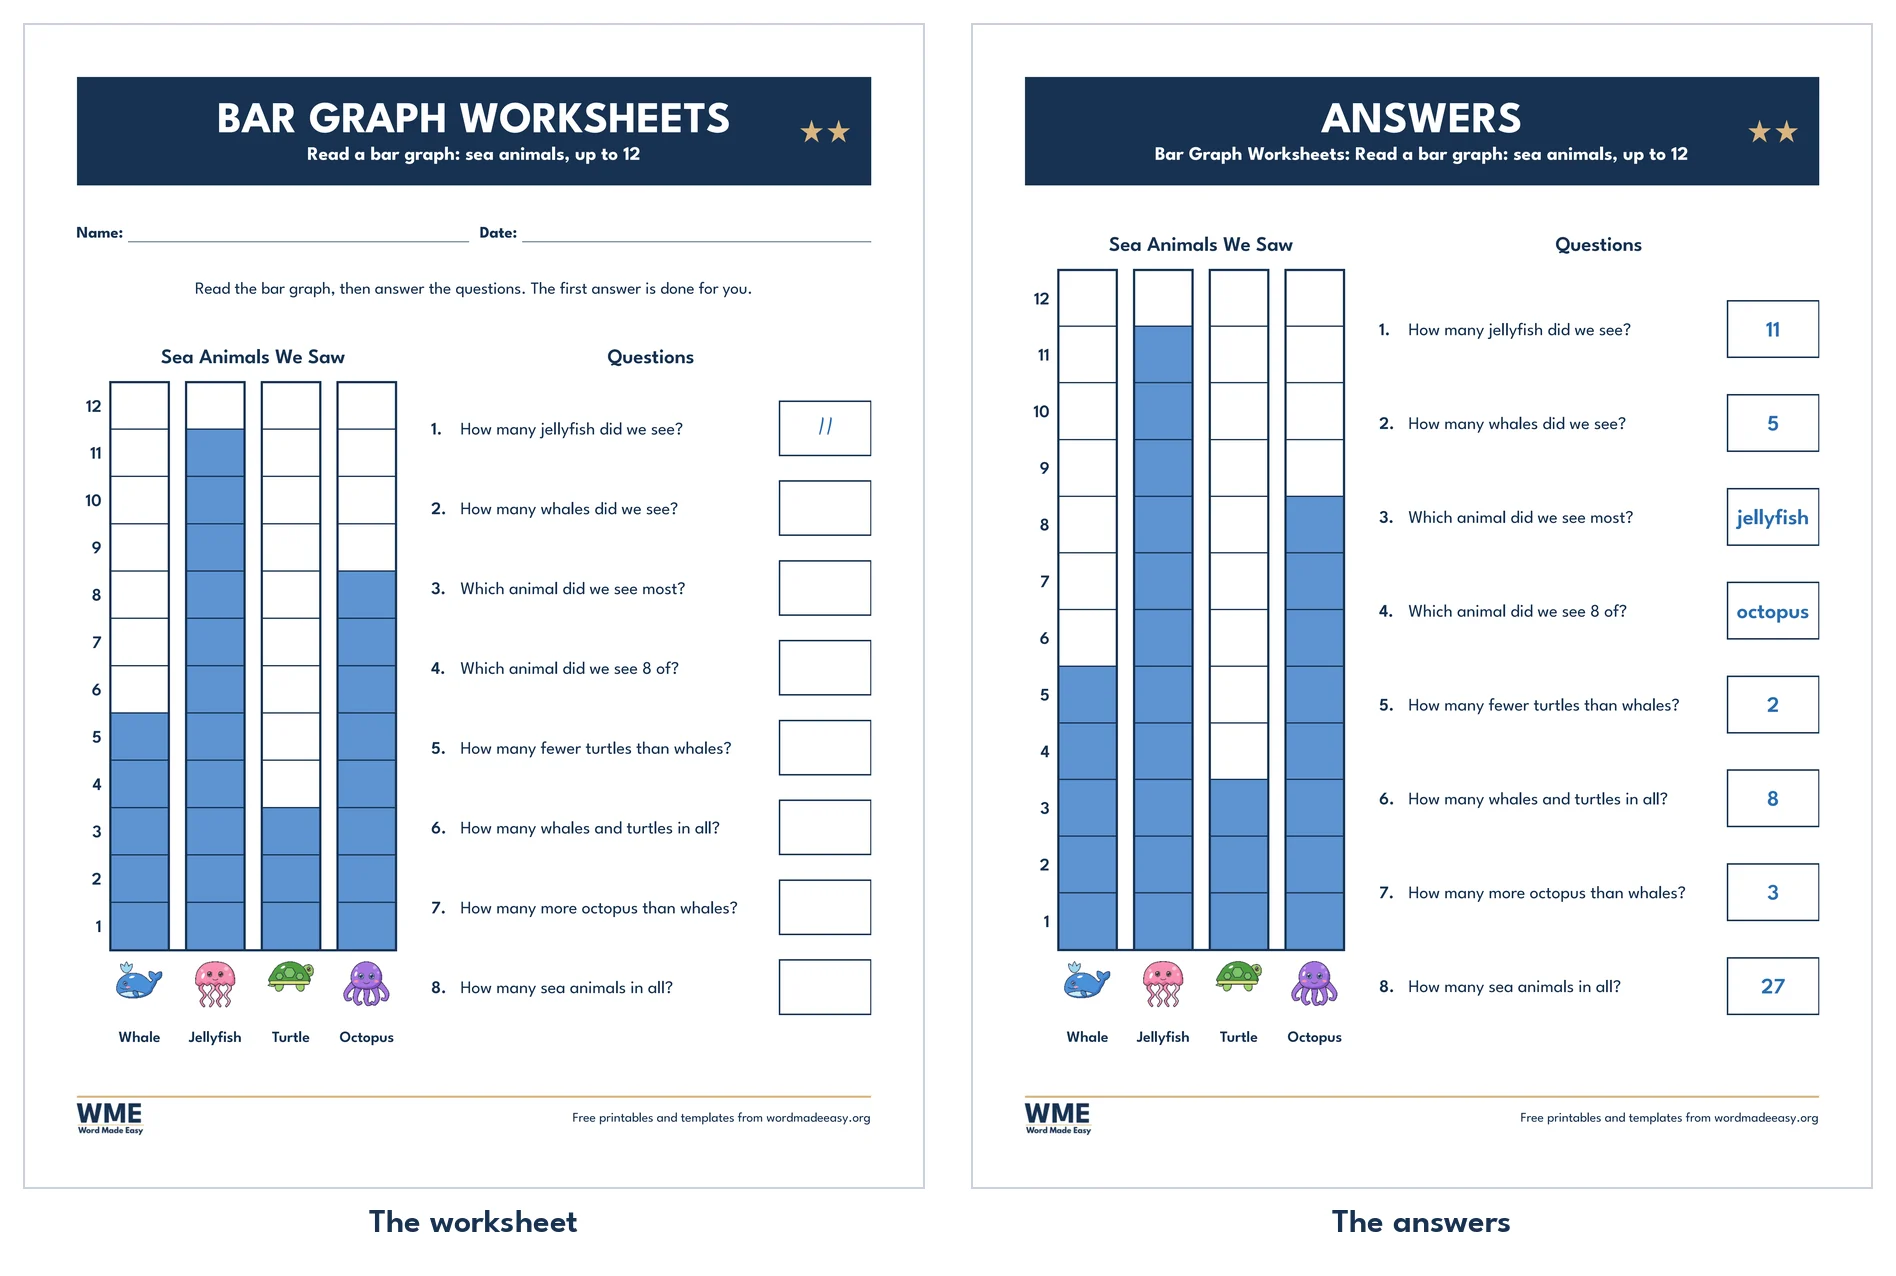
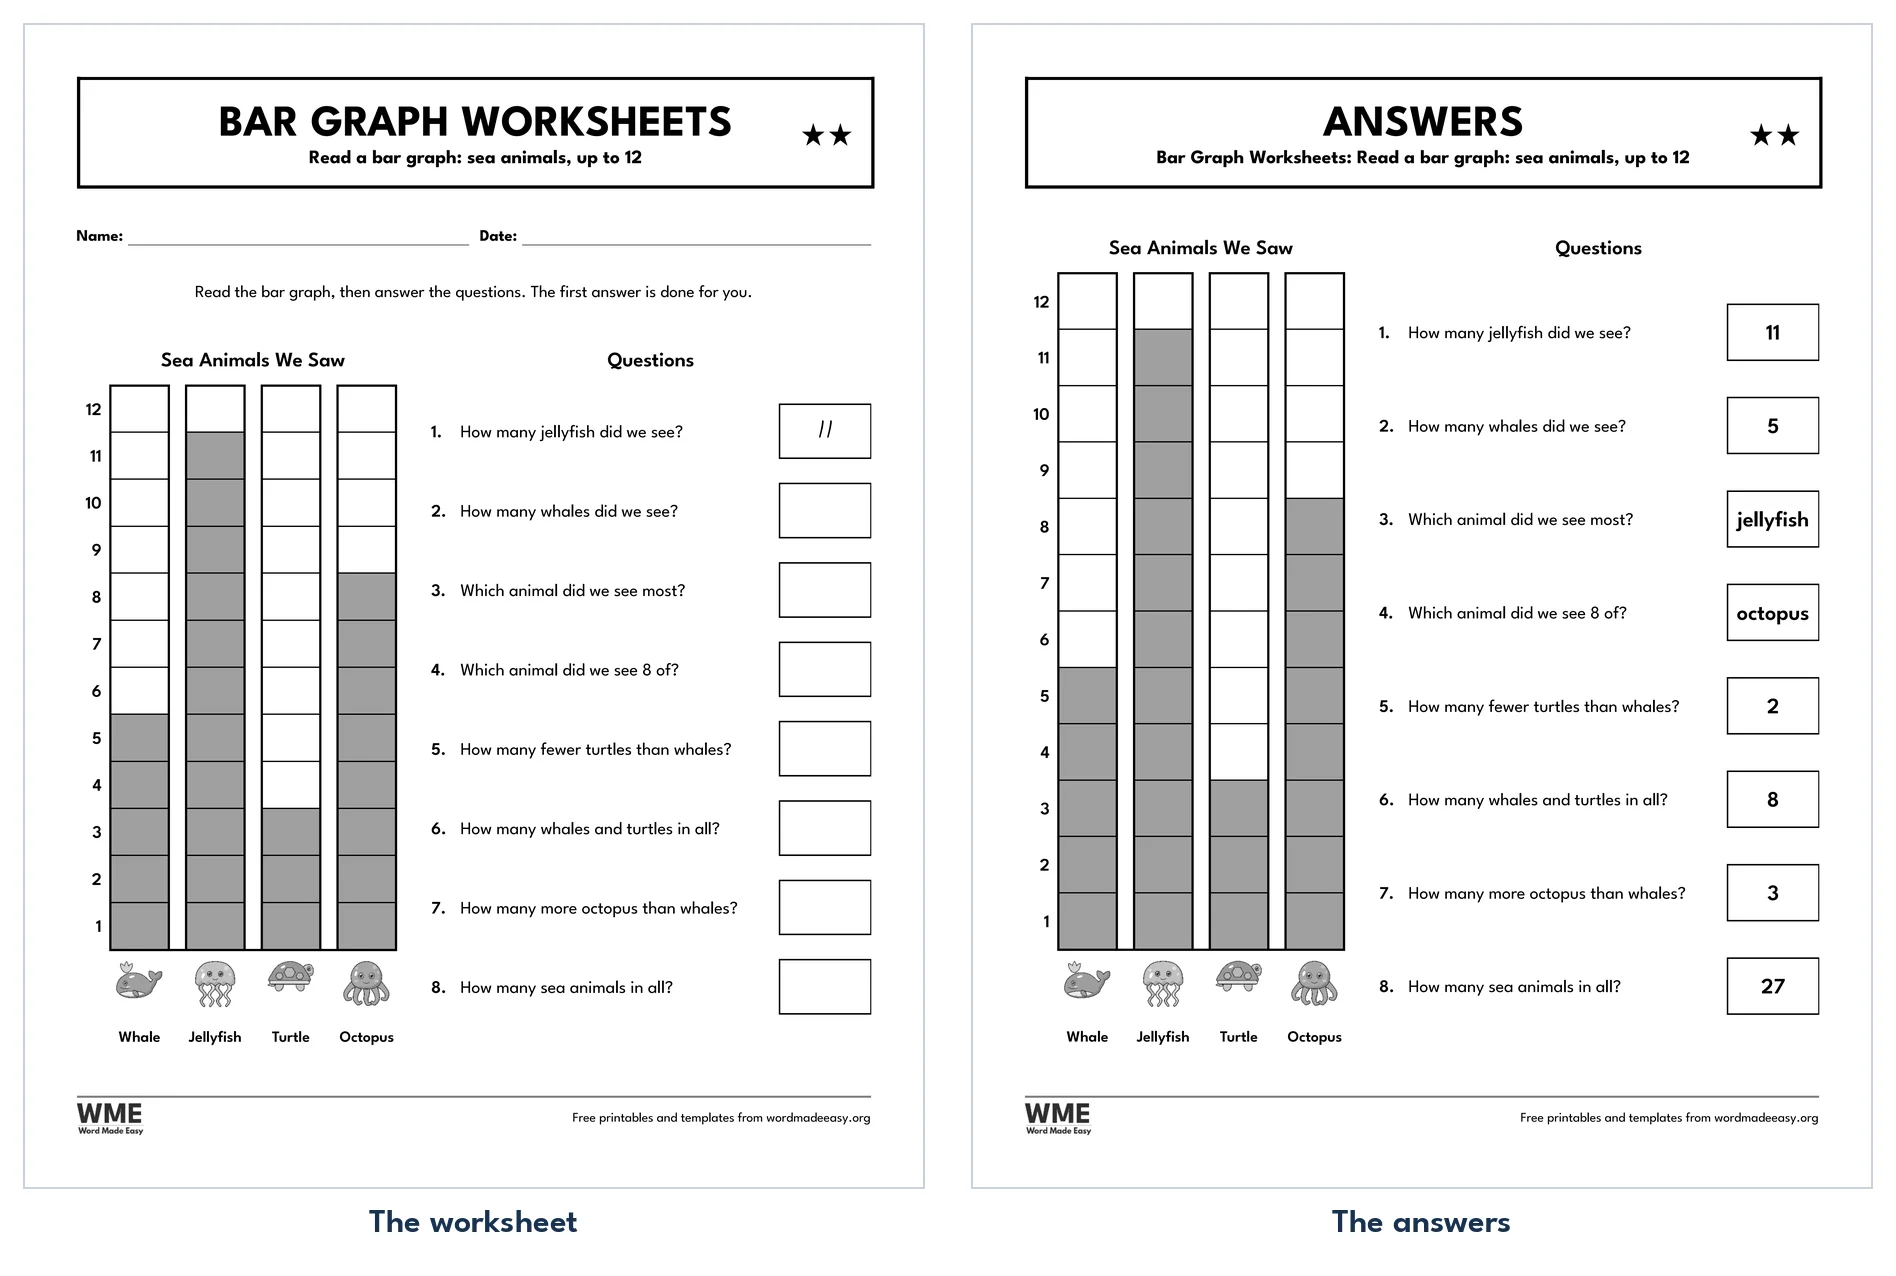
| Read the Bar Graph 4 | 2 stars: Read a bar graph of sea animals to 12, 8 questions, with answers |
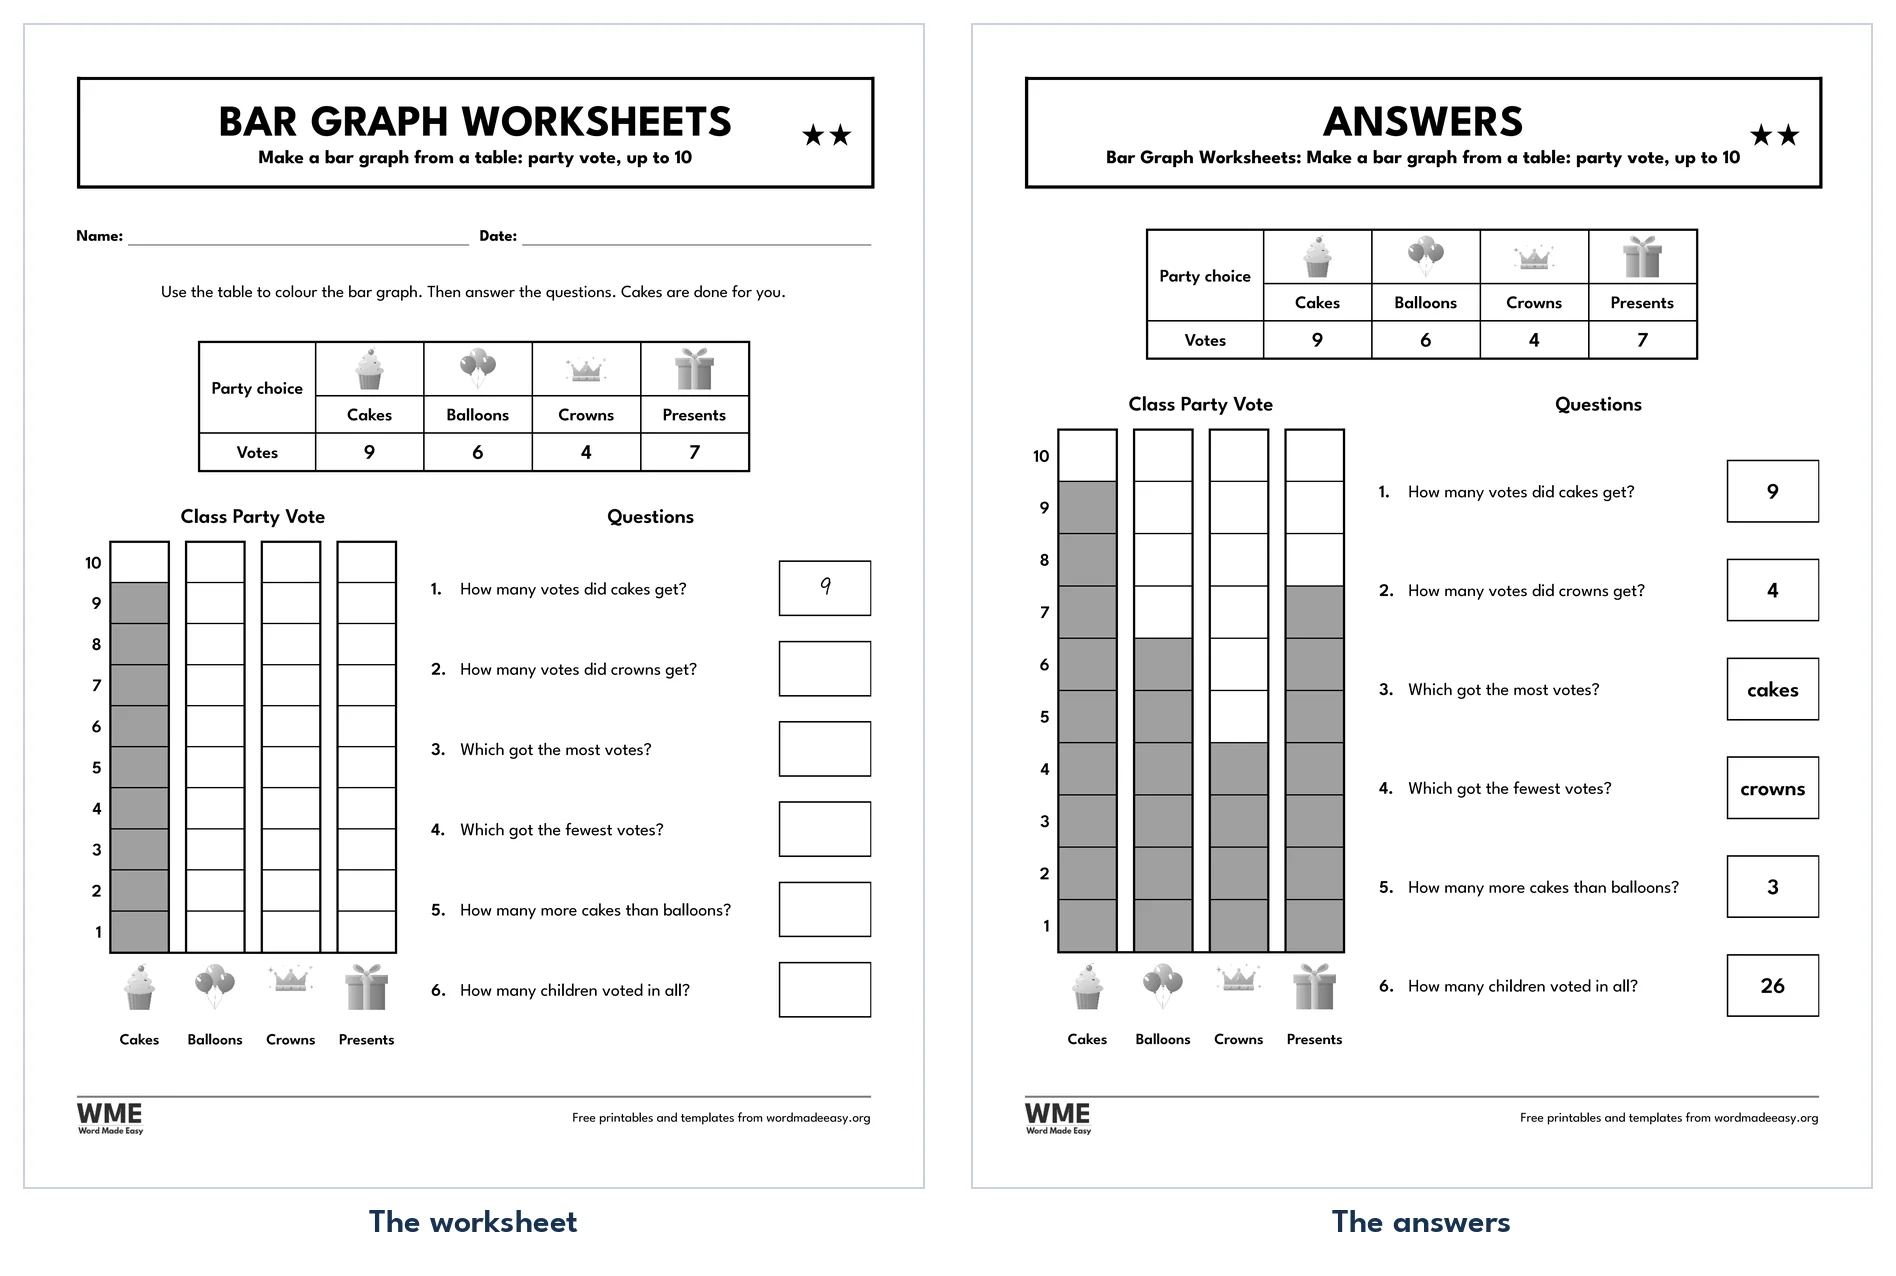
| Make the Bar Graph 5 | 2 stars: Colour a bar graph from a data table, 6 questions, with answers |
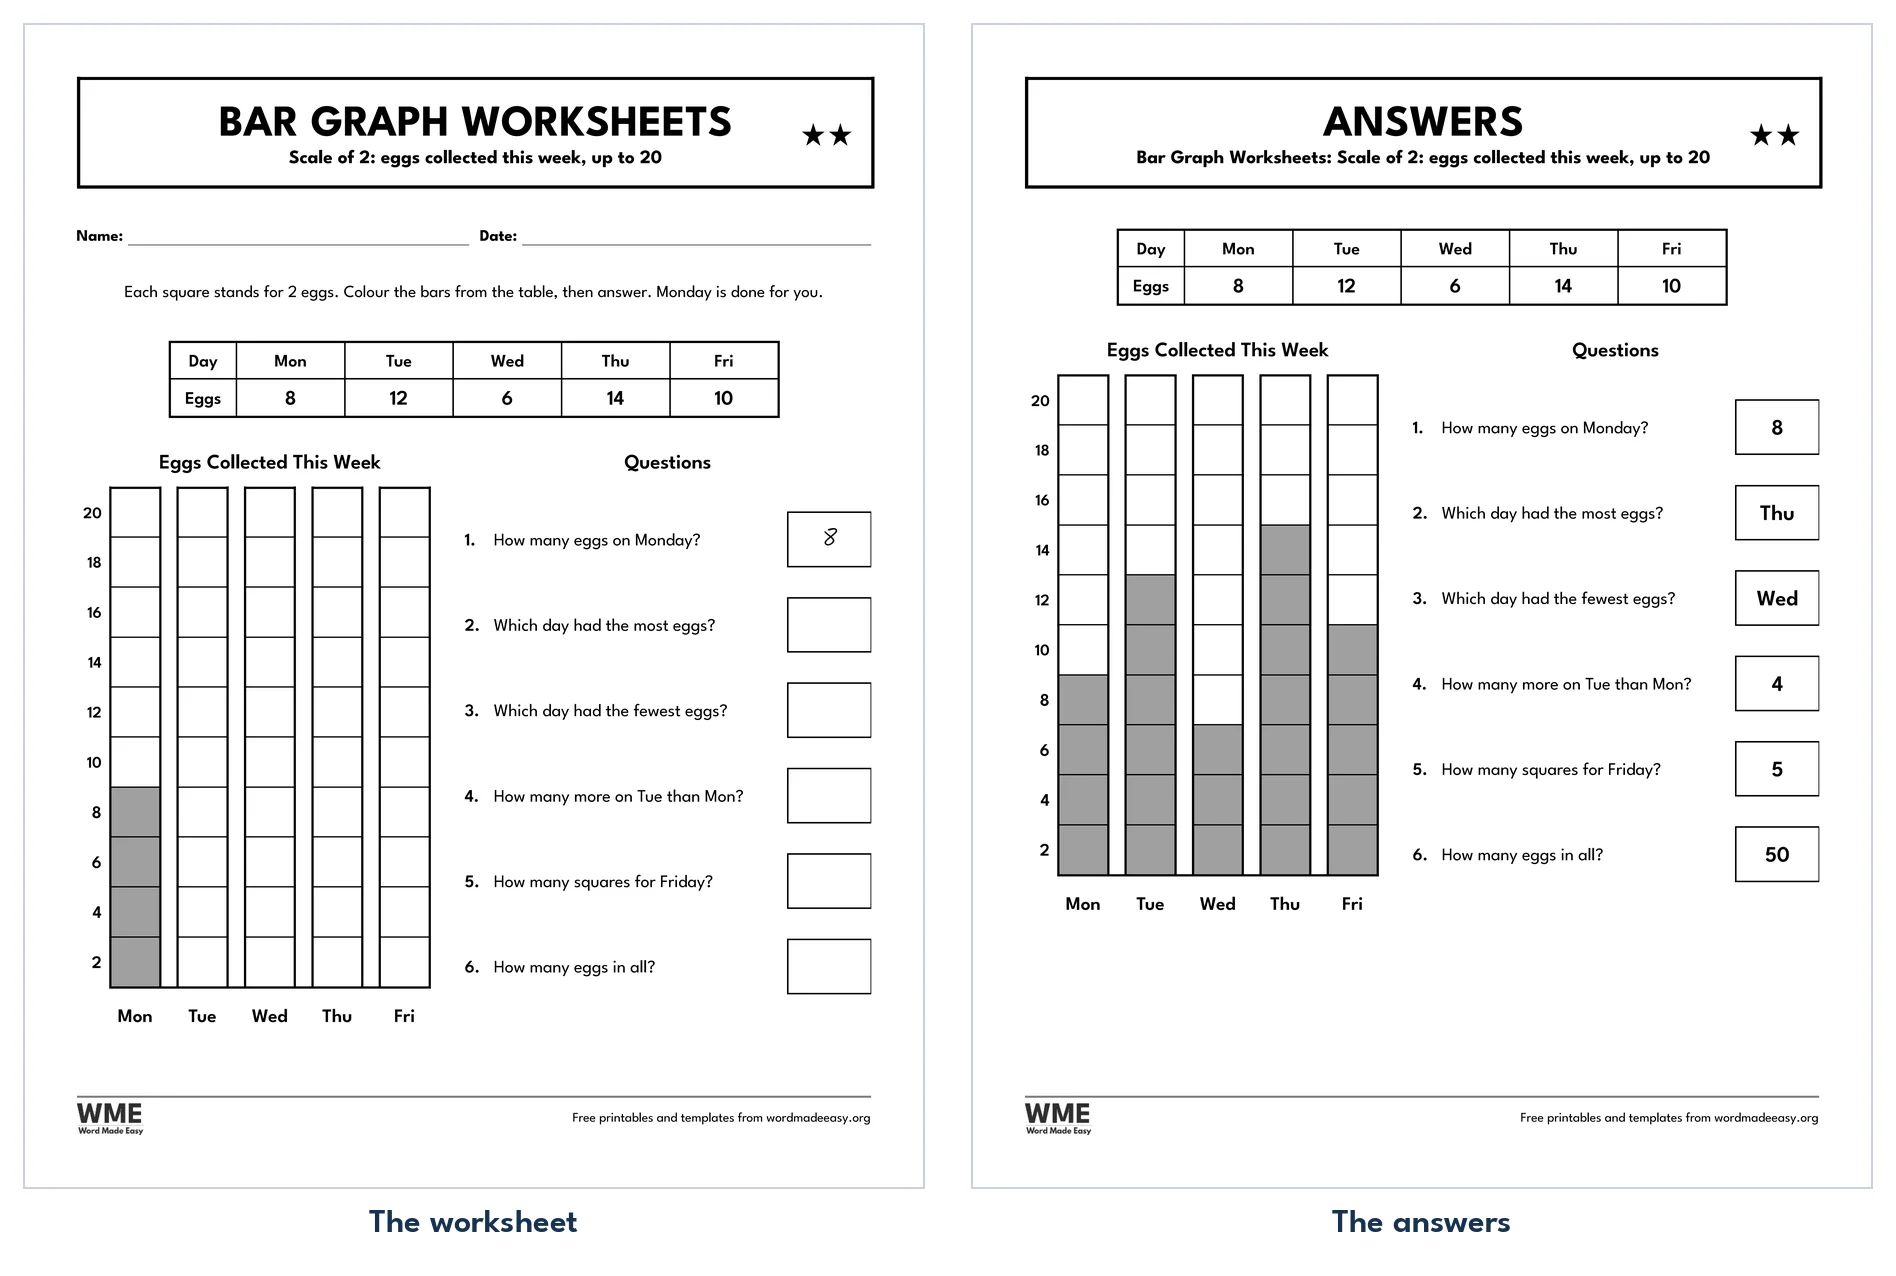
| Make the Bar Graph 6 | 2 stars: Draw a bar graph with a scale of 2 from a table, 6 questions, with answers |
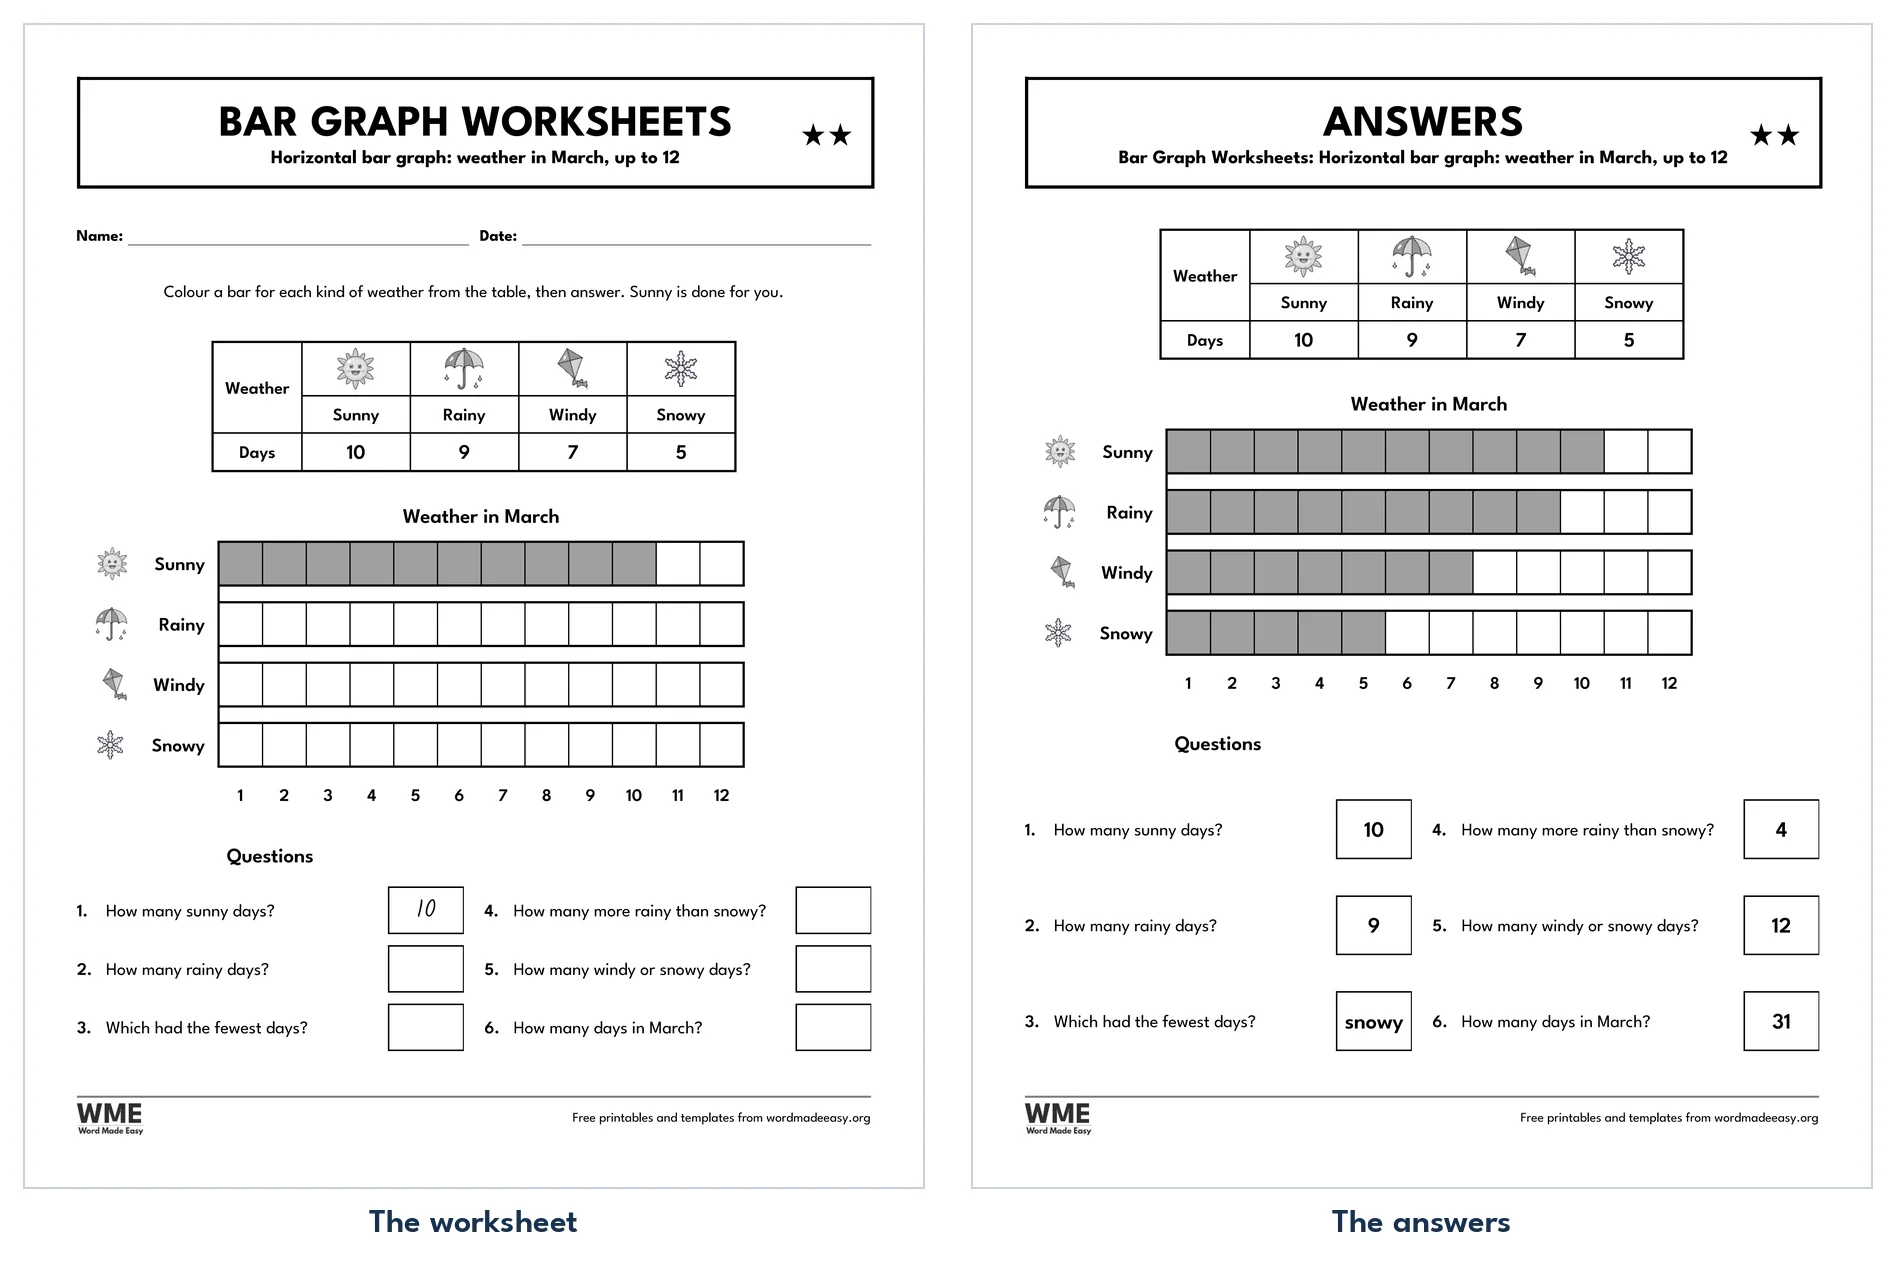
| Horizontal Bar Graph 7 | 2 stars: Colour a horizontal bar graph of the weather, 6 questions, with answers |
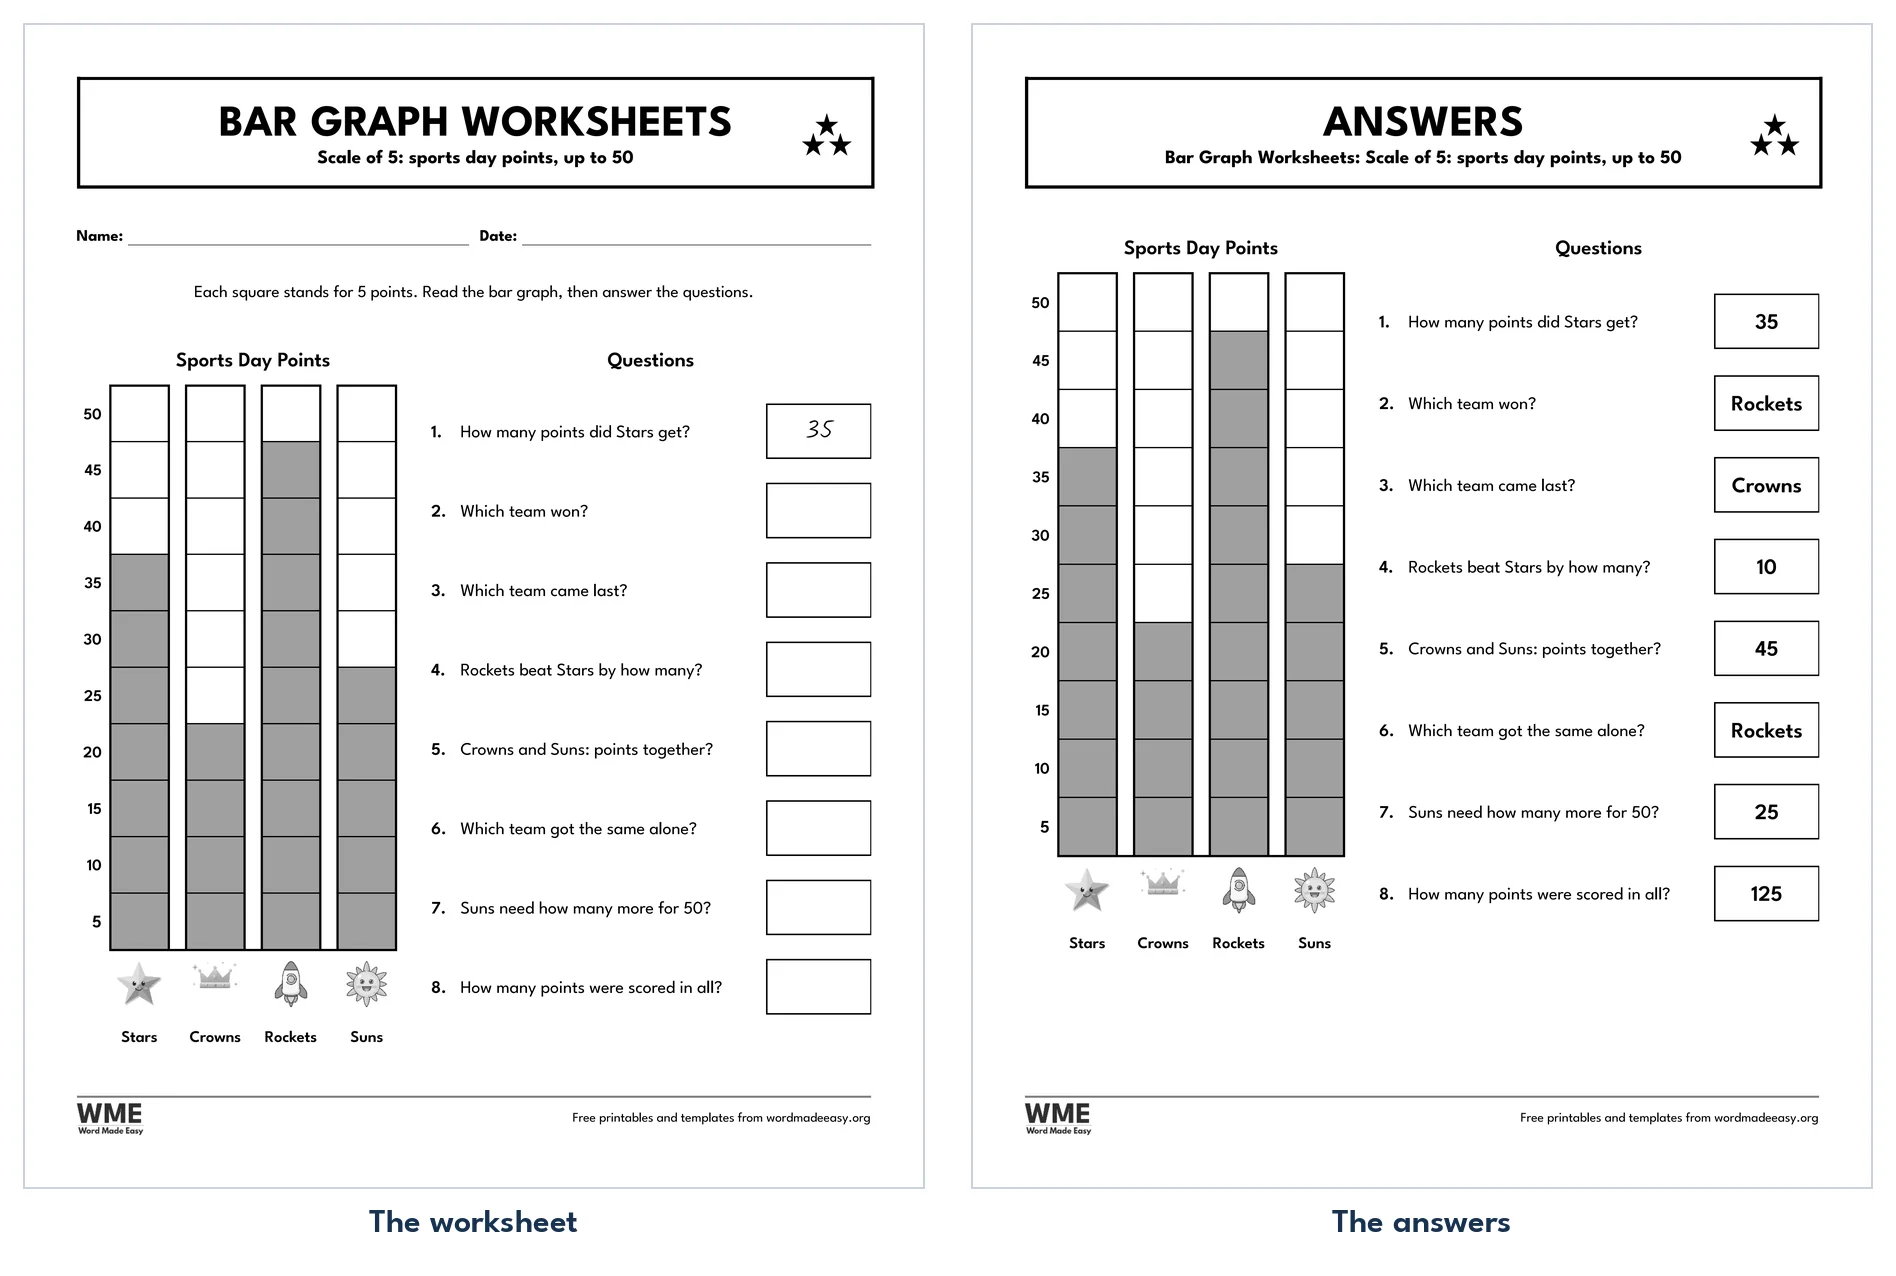
| Read the Bar Graph 8 | 3 stars: Read a bar graph with a scale of 5, 8 harder questions, with answers |
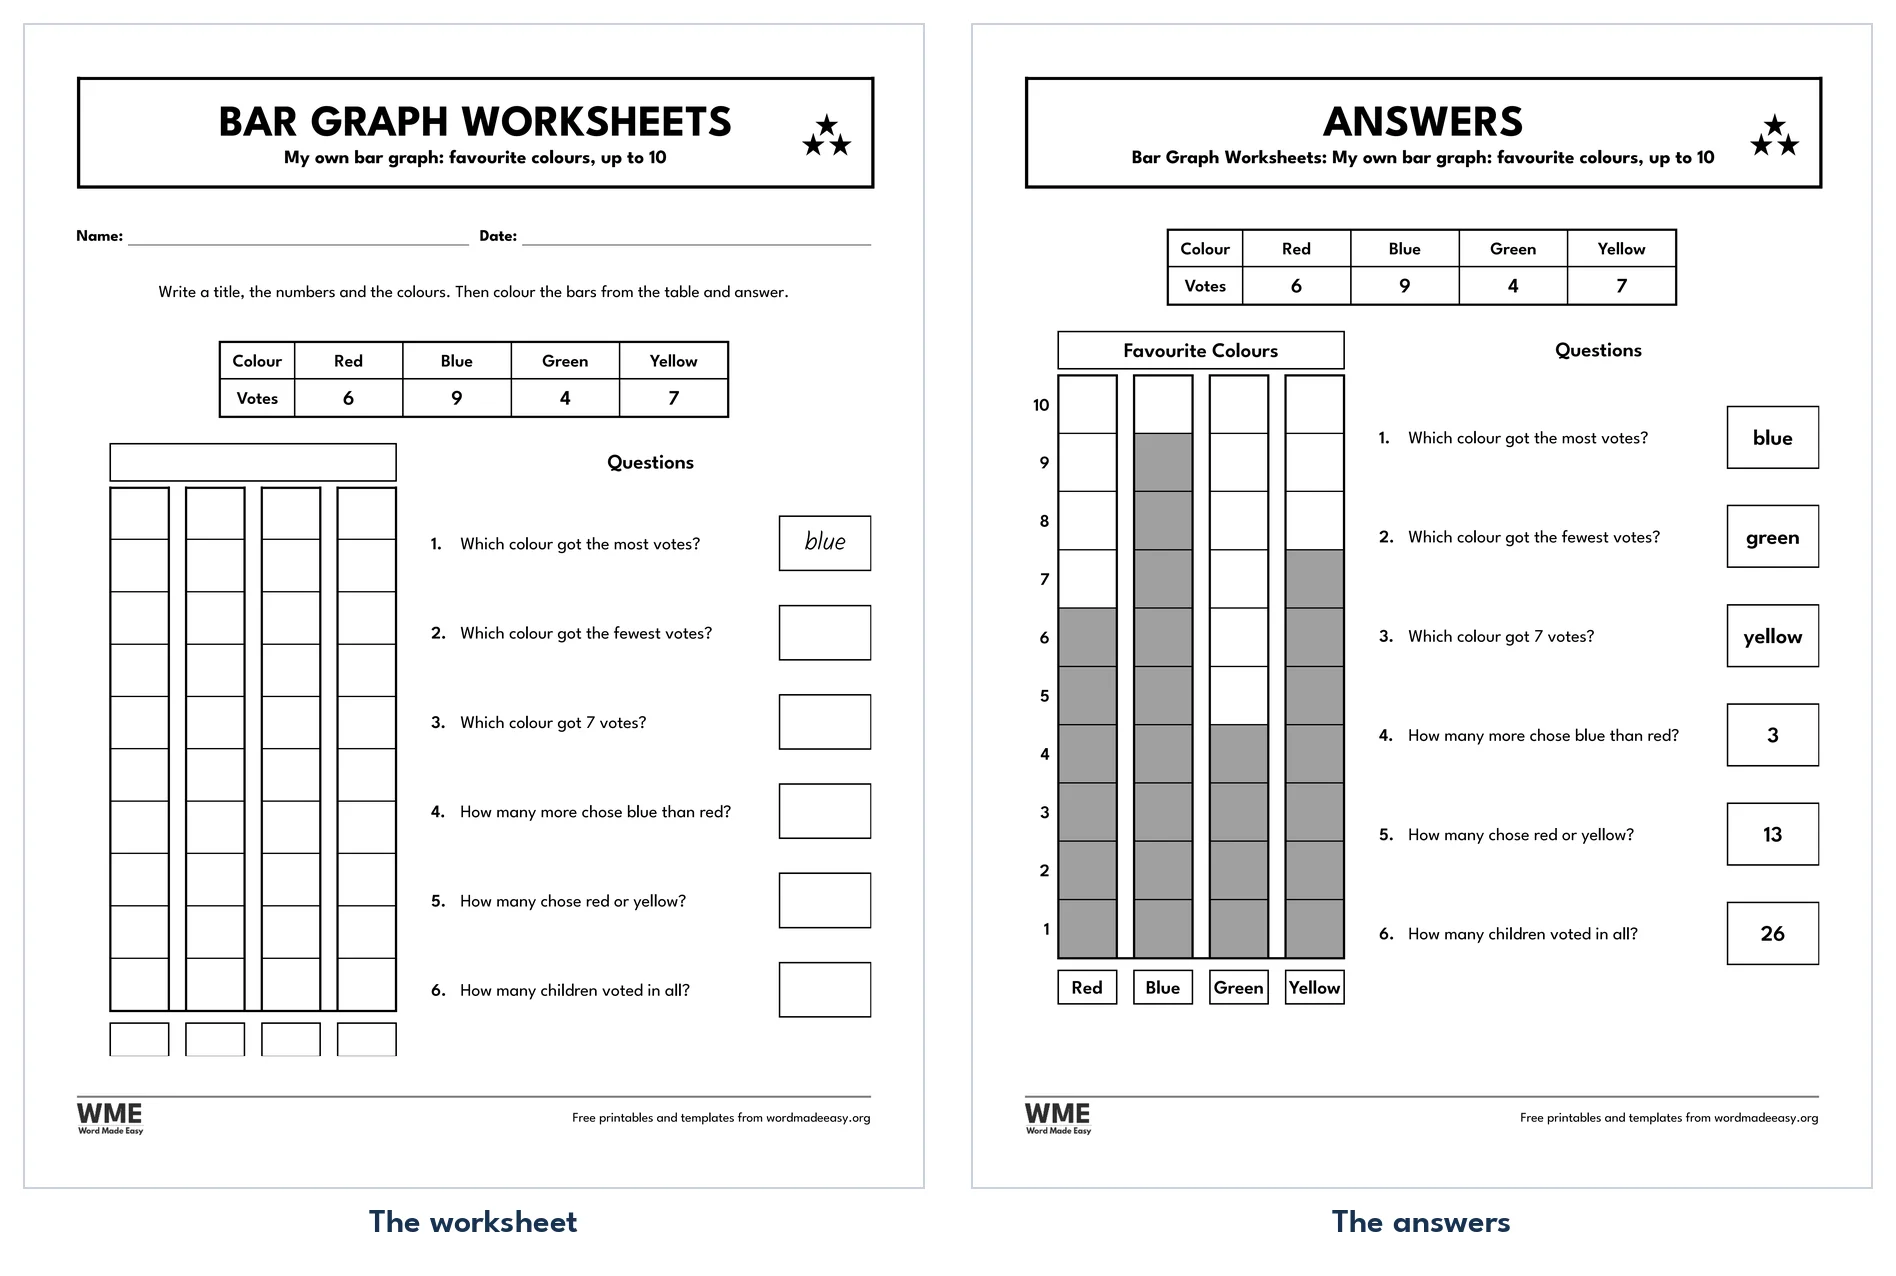
| My Own Bar Graph 9 | 3 stars: Write the title, numbers and labels, then draw the bars, 6 questions, with answers |
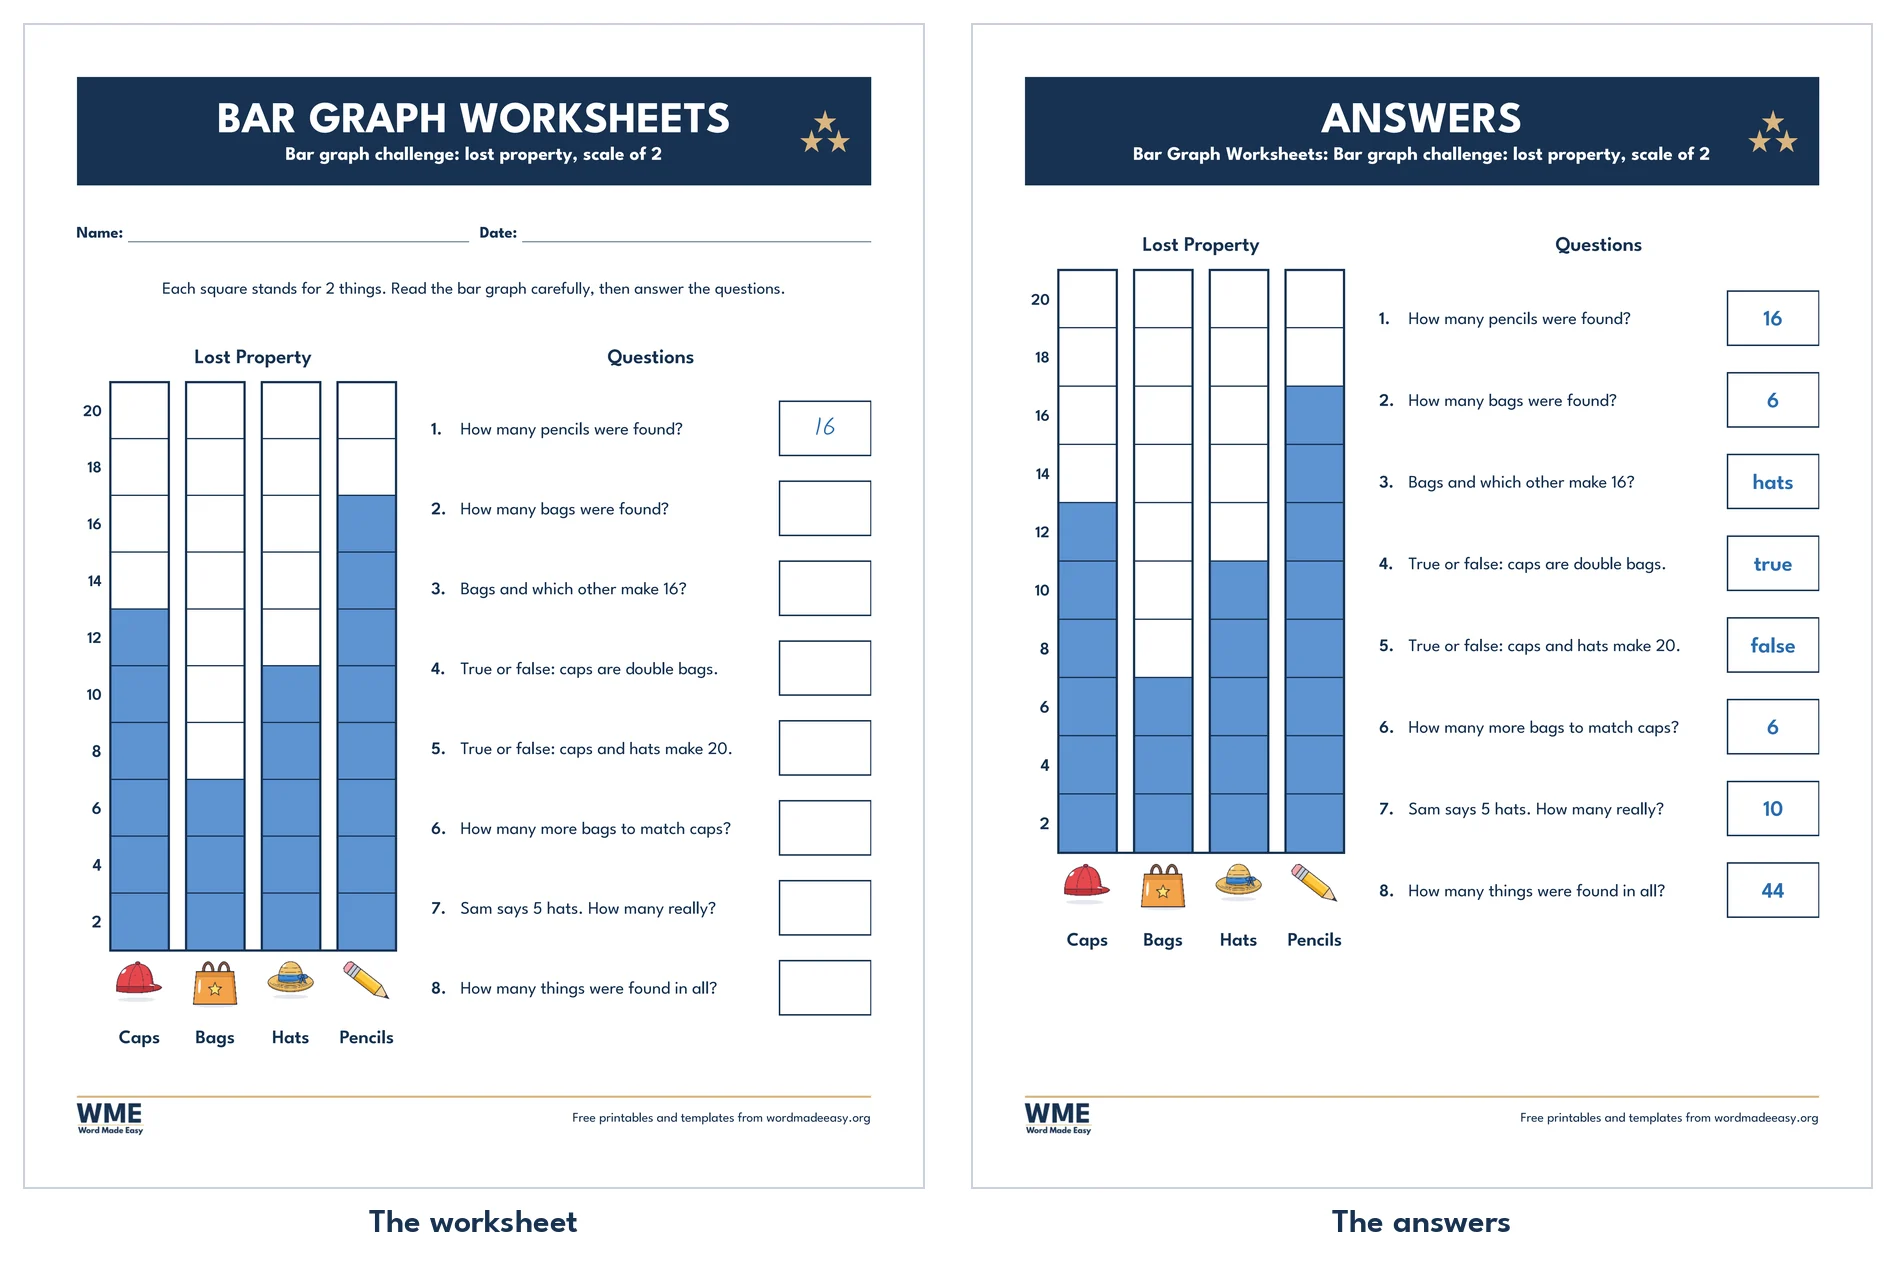
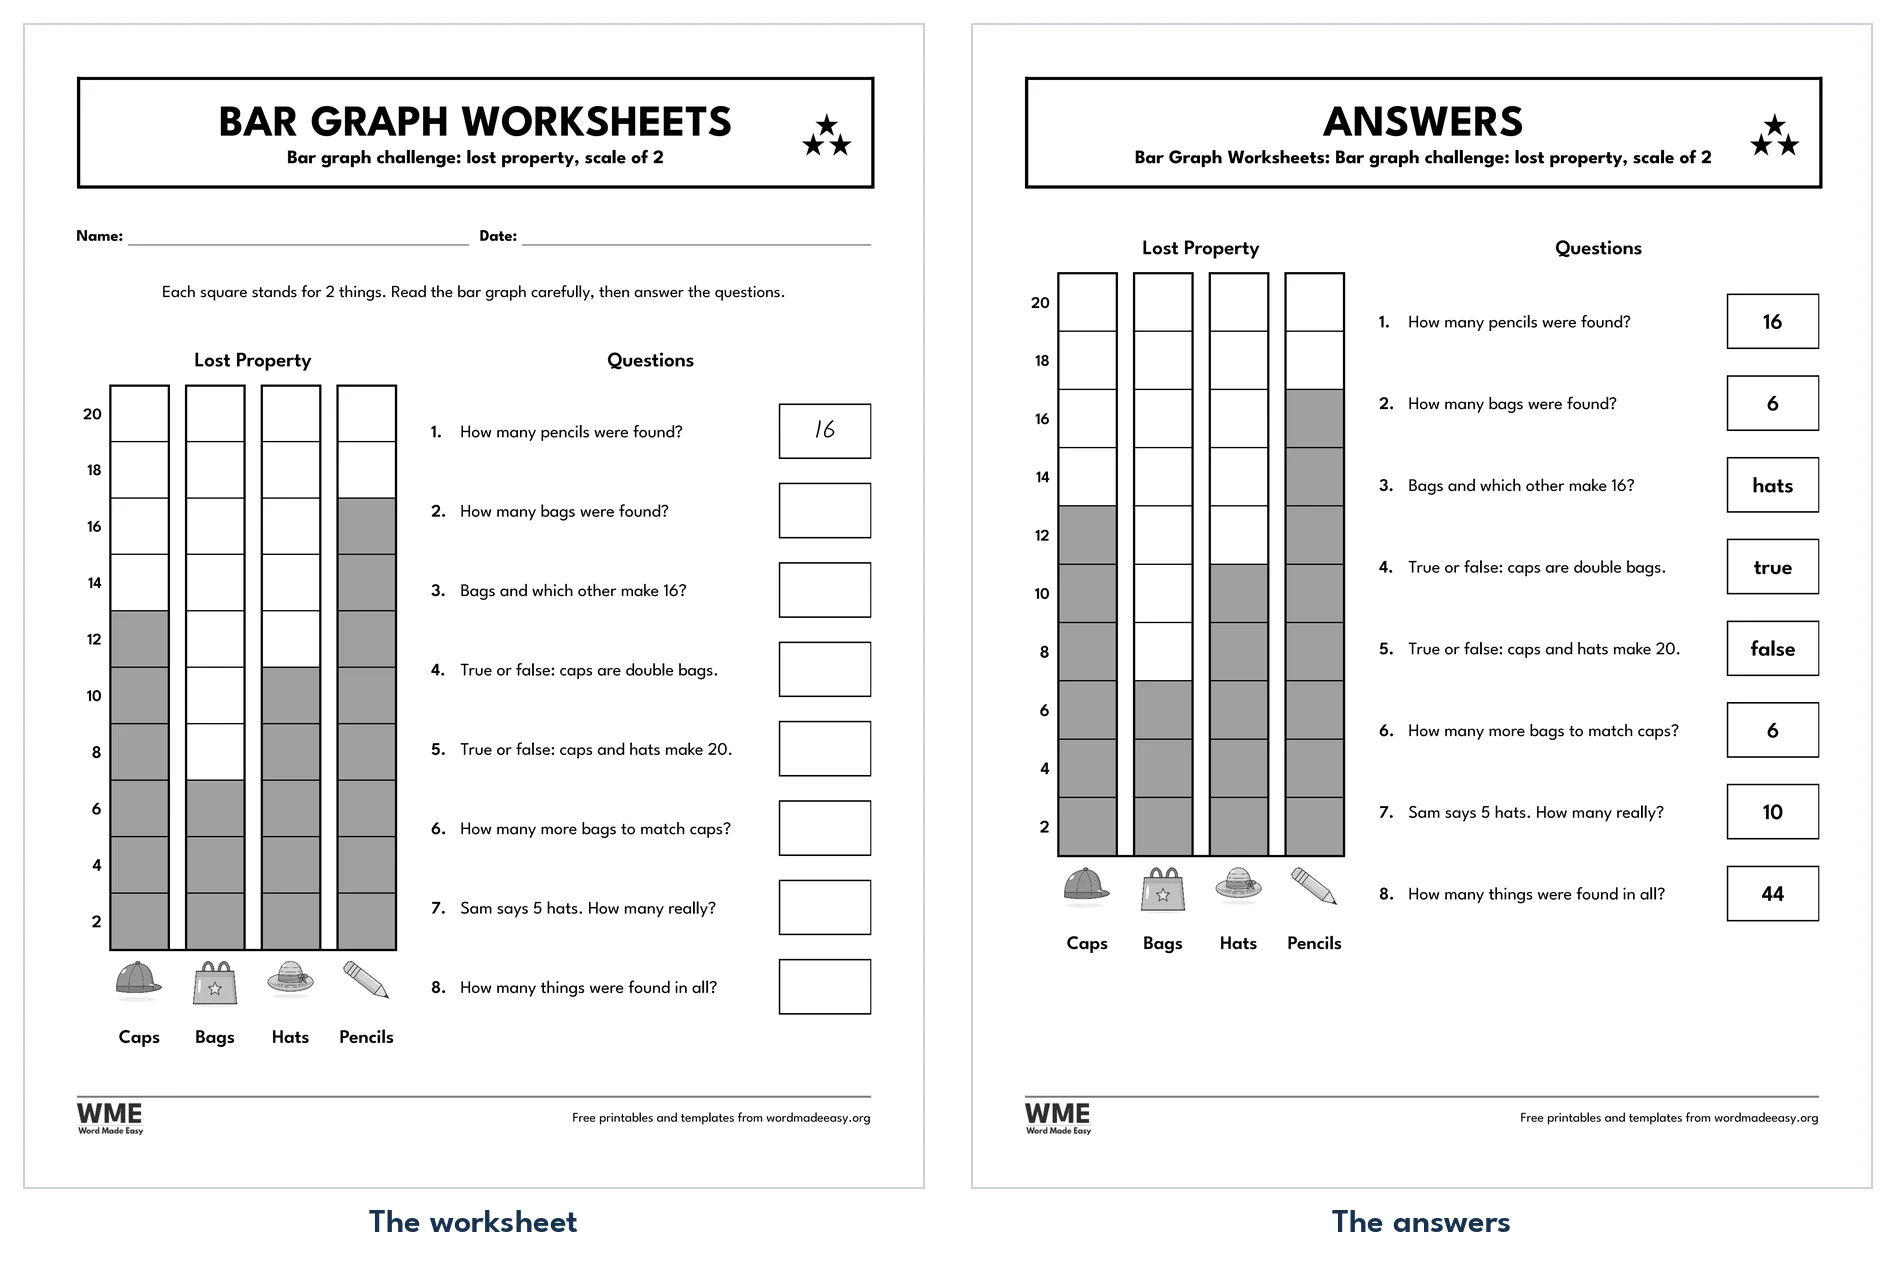
| Bar Graph Challenge 10 | 3 stars: Mixed reasoning questions on one bar graph with a scale of 2, with answers |
👉 Each graph is a Word table: the title, axis numbers, labels and questions are typed text, and the bars are shaded cells, so a teacher can change the data and shade new bars. Page 2 of every file is the answer page.
What Are the Parts of a Bar Graph?
A bar graph has a title that says what was counted, a label under each bar that names the category, and numbers up the side (the scale) that show how much each bar is worth. Each bar is drawn as a stack of squares from the line at the bottom, called the baseline. When the scale goes up in 1s, the number of squares is the answer. When it goes up in 2s or 5s, each square is worth 2 or 5, so a bar of 7 squares on a scale of 5 means 35. Reading bar graphs well means checking the scale first, every time.
Which Bar Graph Worksheet Should You Start With?
- The gold stars in the title bar of each sheet show its level, and the pack is in order: three one-star sheets, four two-star sheets, then three three-star sheets.
- Count and Graph 1 and 2 (1 star): count farm animals, then toys, in a picture box and colour one square for each; the first bar is coloured for you.
- Read the Bar Graph 3 (1 star): a finished graph of favourite pets to read, with eight questions from “how many?” to “how many in all?”.
- Read the Bar Graph 4 (2 stars): sea animals on a scale up to 12, with “how many fewer” questions.
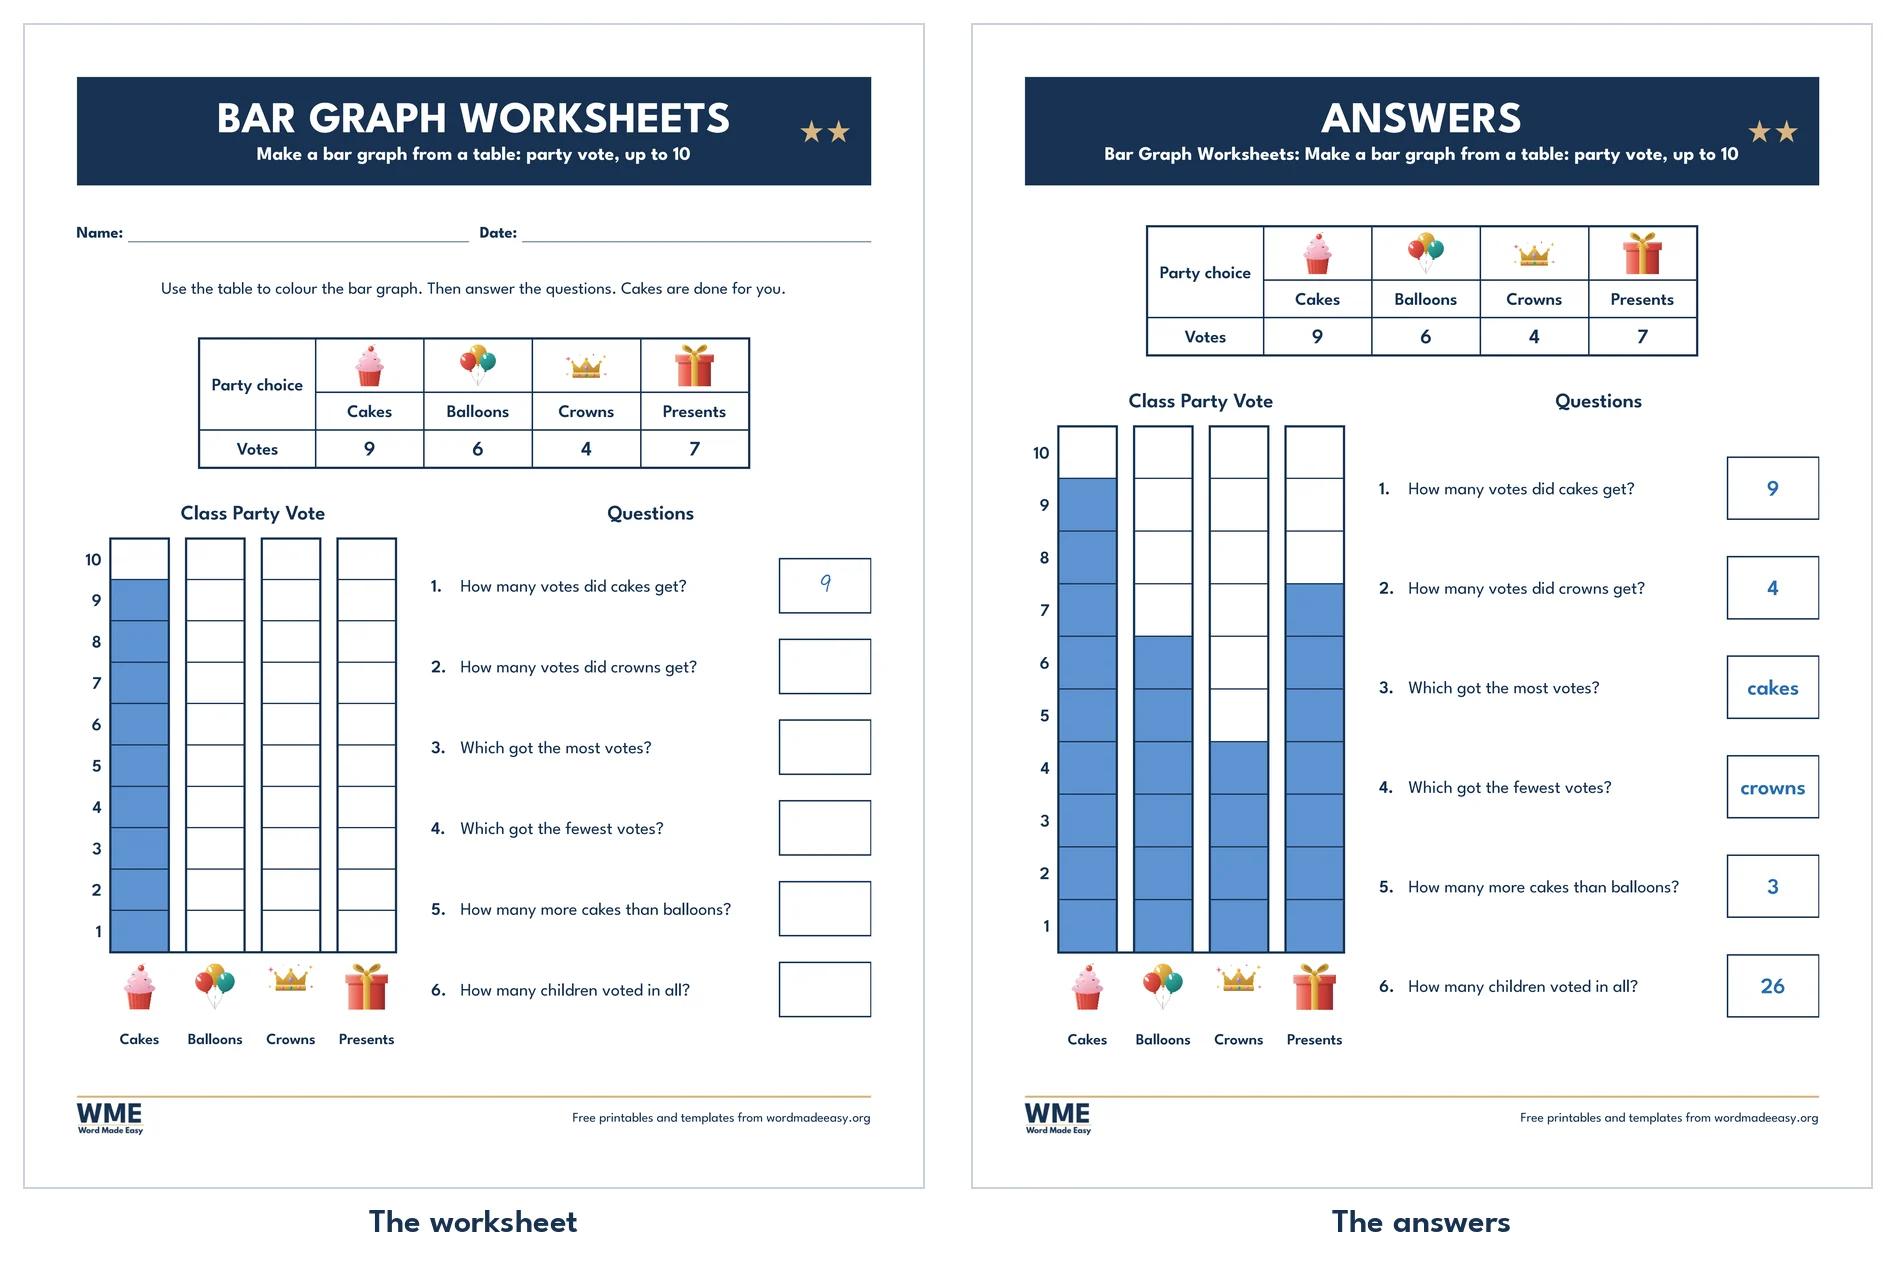
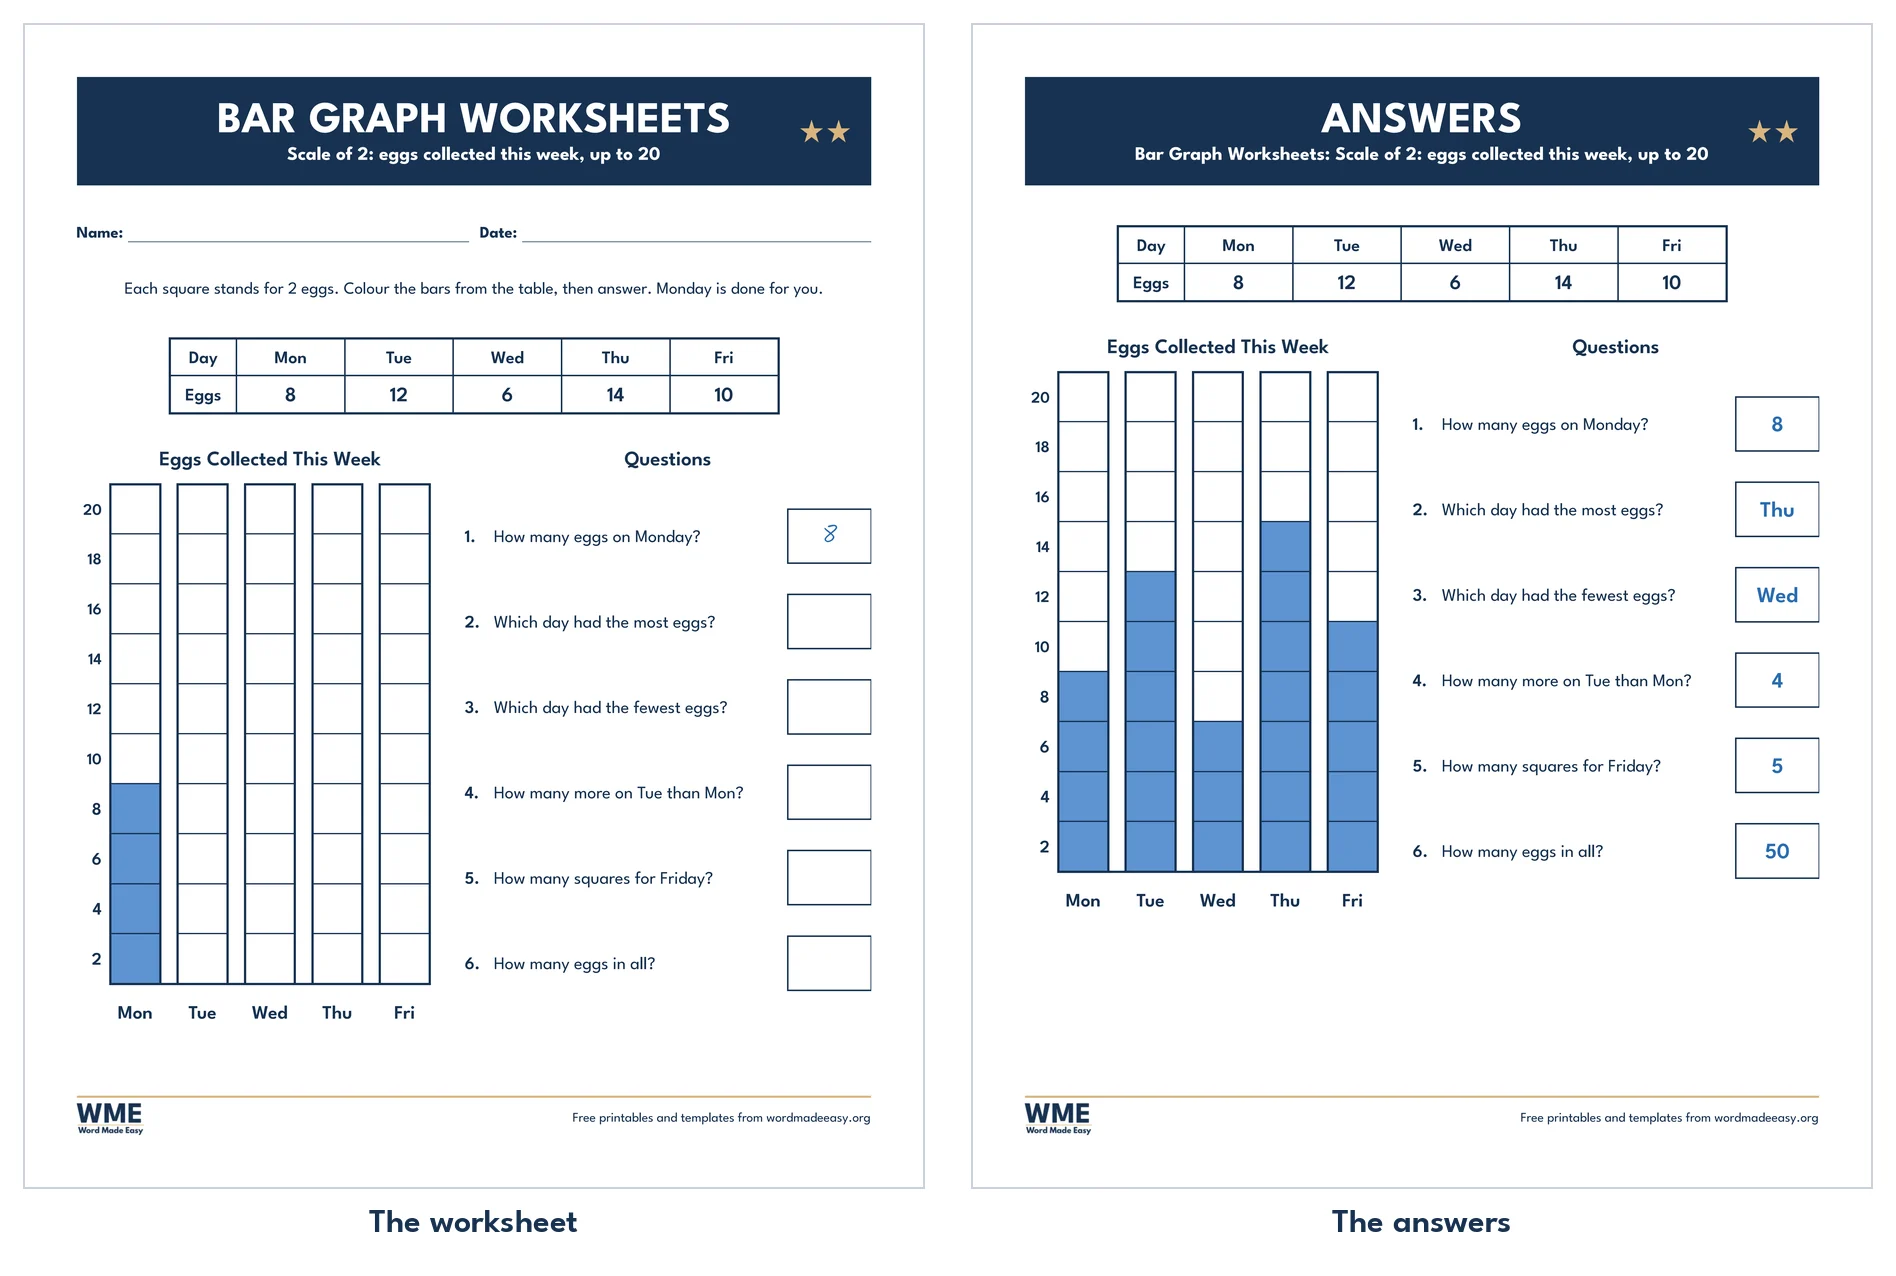
- Make the Bar Graph 5 and 6 (2 stars): the numbers come in a data table and children colour the bars: a class party vote, then eggs collected from Monday to Friday on a scale of 2.
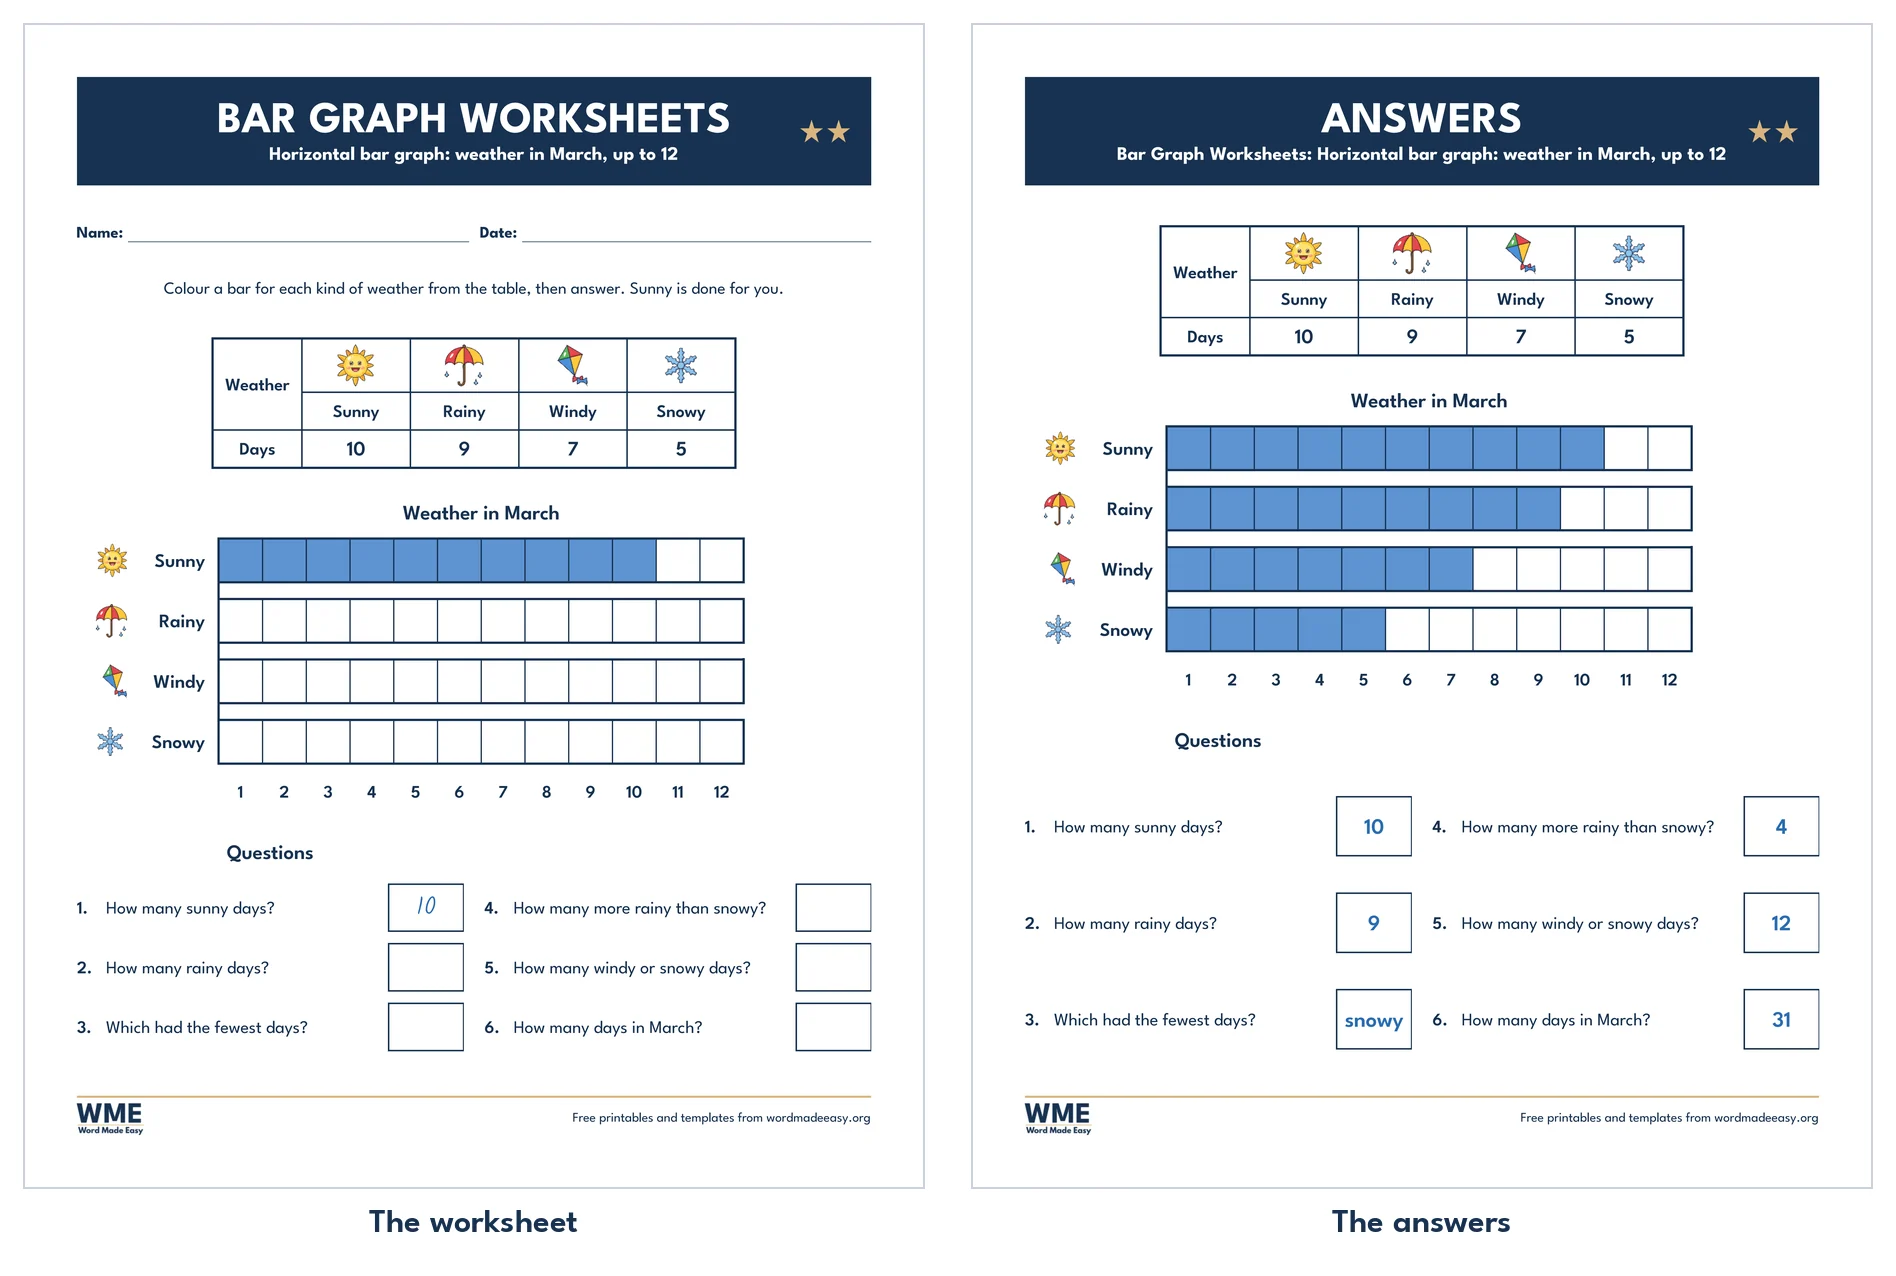
- Horizontal Bar Graph 7 (2 stars): the days of sun, rain, wind and snow in March as bars that run across the page.
- Read the Bar Graph 8 (3 stars): sports day points on a scale of 5, with harder questions that combine two teams.
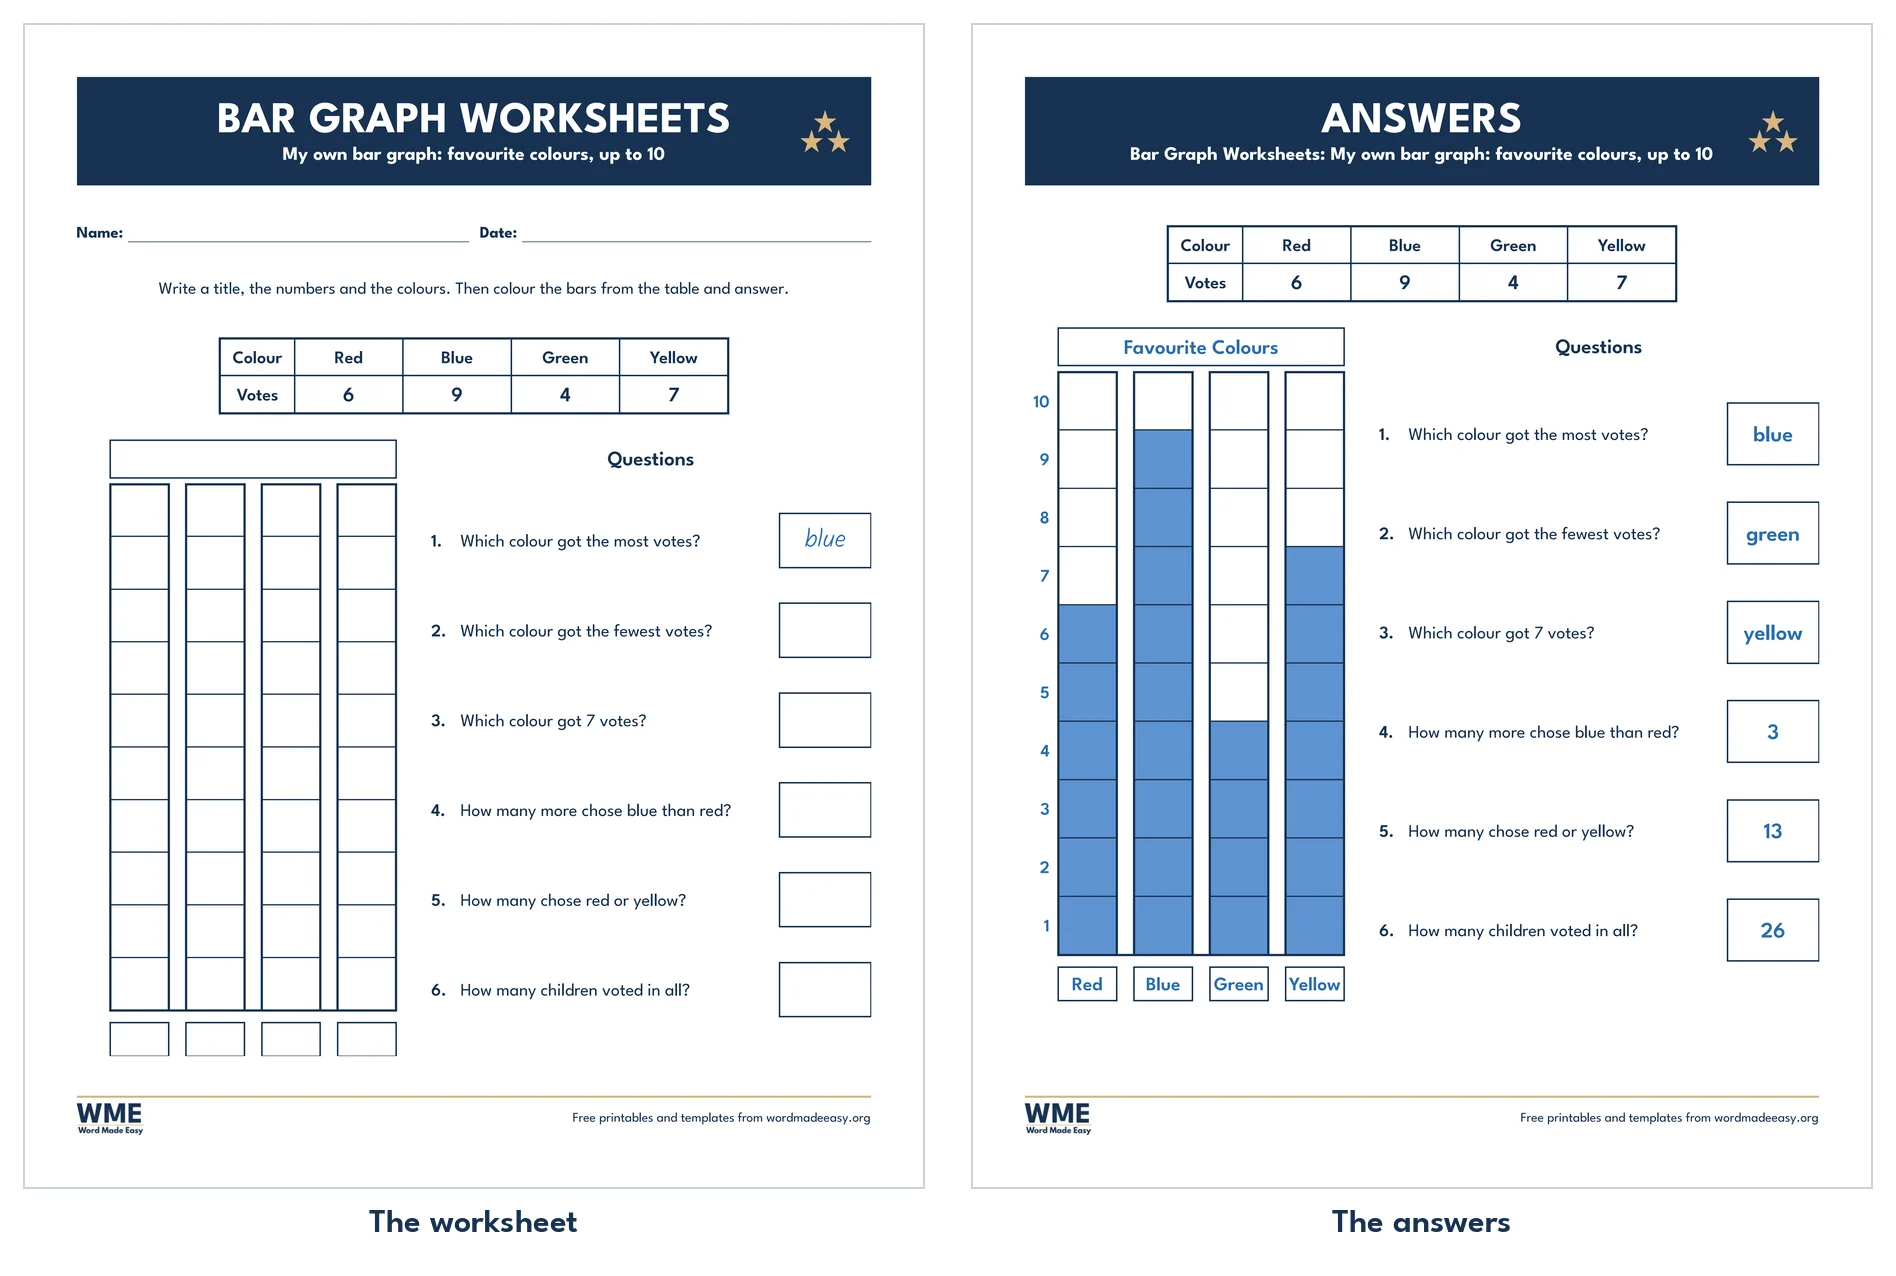
- My Own Bar Graph 9 (3 stars): a survey of favourite colours: children write the title, the numbers and the labels, then draw the bars.
- Bar Graph Challenge 10 (3 stars): lost property on a scale of 2, with true or false, “which two make 16?” and a wrong answer to correct.
- Bar graphs often start from a tally: the sister page of tally marks worksheets practises tallying, and the Christmas pictograph worksheets show the same kind of data as rows of pictures.
How to Use the Bar Graph Worksheets
- Choose a sheet in the preview above, download A4 or US Letter and print page 1.
- Read the title and the labels aloud, then look at the numbers up the side to find the scale.
- On the colouring sheets, colour from the baseline up, one square at a time, and tick each picture or number as it is used.
- Answer the questions in order: the first few read one bar, the later ones compare two or more.
- Mark with page 2, then ask the child to write one more question about the graph for a partner.
The most common slip on a scale of 2 or 5 is counting squares instead of reading the scale, so a bar of 7 squares is called 7 instead of 14 or 35. Ask “what is one square worth?” before any reading starts, and lay a ruler across from the top of the bar to the numbers. When colouring, children sometimes start a bar in mid-air: the baseline is always the starting point. To practise counting in steps before the scale sheets, try the skip counting worksheets, and for blank squares to draw any graph, the graph paper prints a full grid.
Black and White Versions
Every bar graph worksheet also comes in black and white: black grid lines and text, grey bars and grey pictures, so the squares stay easy to count on a home printer. Choose Black and white in the download box, or All to get both.
How to Print the Bar Graph Worksheets
Want to print without editing? Every download has three folders: the editable Word files, the same sheets as PDFs, and every page as a print-ready image (JPEG), so you can print straight away without opening Word.
Print at 100% (Actual size) on the paper the file was made for, A4 or US Letter, so the squares stay big enough to colour neatly. Page 1 is the worksheet and page 2 the answers: print page 1 for the class.
FAQs
Are these bar graph worksheets free?
Yes. All ten bar graph worksheets are free: choose A4 or US Letter, colour or black and white, and download them in one ZIP file.
Is there an answer key?
Yes. Page 2 of every Word file is the answer page, with every bar coloured in and every answer in blue.
How do you read a bar graph?
Read the title and the labels, then check the scale up the side. Find the top of a bar and read across to the scale: on a scale of 1 that is the number of squares, on a scale of 2 or 5 multiply the squares by 2 or 5.
What is the difference between a bar graph and a pictograph?
A bar graph shows amounts as bars of squares against a scale; a pictograph shows them as rows of pictures with a key. Both show the same data, and the sister page of Christmas pictograph worksheets has the picture version.
What grade are these bar graph worksheets for?
The count and graph sheets suit kindergarten and grade 1 in the US, or Year 1 in the UK. The scale, horizontal and challenge sheets suit grade 2 and 3, or Year 2 to Year 3, where bar charts with scales are taught.
Can I change the data?
Yes. Each graph is a Word table: retype the numbers and labels, and shade or clear squares with the cell shading button to draw new bars.
Conclusion
Ten bar graph worksheets, from a first count and graph to a scale-of-5 challenge, each with an answer page and editable in Microsoft Word.
Download your paper size above, and for counting in steps before the scale sheets, open the skip counting worksheets.
Related Tutorials
- Skip Counting Worksheets
- Free Graph Paper for Word
- Free Addition and Subtraction Worksheets for Word
Maths Resources
Recently Added Maths Resources
Browse all free maths resources for home and school, all made by a teacher.
Leave a comment
Have a question about these resources, or an idea for a new one? Ask below.